To Err is Human

To Err is Human: Building a Safer Health System is a classic report in the field of patient safety that was published in 2000 by the Committee on Quality of Health Care in America (Institute of Medicine). My notes from the book (focused mostly on the first few chapters, which are about errors and adverse events, which I’m currently reading about as I’m looking for the best way to measure this in my evaluation of a healthcare IT project) are presented below.

Definitions

Error

    • safety = “freedom from accidental injury” (p. 4) “Safety is a characteristic of systems and not of their components. Safety is an emergent property of systems” (p. 157)
    • accident = “an event that involves damage to a defined system that disrupts the ongoing or future output of that system” (p. 52)
    • error = “a failure of a planned action to be completed as intended or the use of a wrong plan to achieve an aim” (p. 4) – not all errors cause harm
      • errors depend on 2 kinds of failures:
        • error of execution: “correct action does not proceed as intended” (p. 4) – intended outcome may or may not occur
        • error of planning: “original intended action is not correct” (p. 4) – desired outcome cannot be achieved
      • errors can happen in any stage of care (e.g., prevention, diagnosis, treatment)
    • slip – “occurs when the action conducted is not what was intended (an error of execution)” (p. 54) and is observable (e.g., turning the wrong knob on a piece of equipment
    • lapse  – “occurs when the action conducted is not what was intended (an error of execution)” (p. 54) and is not observable (e.g., not being able to recall something from memory)
    • mistake – “the action proceeds as planned but fails to achieve its intended outcome because the planned action was wrong. The situation might have been assessed incorrectly, and/or there could have been a lack of knowledge of the situation […] the original intention is inadequate” (p. 54) (error of planning)
  • preventable adverse events = errors that cause injury
  • adverse event (AE)= “an injury resulting from a medical intervention” i.e., “not due to the underlying condition of the patients”


  • not all AEs are preventable
    • if a surgical patient dies from post-op pneumonia, it’s an AE
    • if that pneumonia was due to poor handwashing or poor instrument cleaning, it’s preventable (i.e., due to an error of execution)
    • if the pneumonia developed by there was no error (e.g., just a poor recovery), it’s not preventable
  • analysis of errors allows us to see if there are opportunities to make our care delivery system better
    • if we blame people for errors:
      • we might be able to prevent that one person from making a similar error in the future
      • but we also make it less likely that people will report errors (and we can’t learn from them if we don’t know about them)
    • if we look at what in the system made the error possible, we might be able to prevent everyone from making a similar error in the future
  • to improve patient safety, we need to be able to identify errors
  • mandatory reporting systems are used to hold healthcare organizations accountable – usually focused on serious harm/death and are punitive
  • voluntary, confidential reporting systems focus on errors more broadly and are intended to focus on learning about where there are weaknesses in the system so that we can fix them before an error leads to serious harm/death
  • with either type of reporting system, there needs to be resources dedicated to following up on the reports – the reporting systems are only useful if we do something with that information
  • since the two types of reporting systems serve different purposes, they should be done separately
  • data collected for the purposes of learning (those not related to serious harm/death) should be protected because fear of legal discovery will discourage people from reporting voluntarily and thus will hamper the efforts to improve the system
  • medication errors tend to be studied because:
    • they are a common type of errors
    • results in significant healthcare costs
    • lots of people are prescribed drugs, so you can get a good sample size
    • drug prescribing process requires good documentation of medical decisions (much of which is in databases we can search)
    • deaths due to med errors are recorded on death certificates [Beth’s note: not sure if this is true in Canada too. Need to look into this.]
  • other types of errors may also offer opportunity to improve, but aren’t as studied [Beth’s note: and even for med errors, we don’t have a lot of good numbers]
  • focus tends to be more on hospitalized patients more than other areas of the healthcare system

Types of Errors

  • Leap et al (1993) classified types of errors:
    • Diagnostic
      • Error or delay in diagnosis
      • Failure to employ indicated tests
      • Use of outmoded tests or therapy
      • Failure to act on results of monitoring or testing
    • Treatment
      • Error in the performance of an operation, procedure, or test
      • Error in administering the treatment
      • Error in the dose or method of using a drug
      • Avoidable delay in treatment or in responding to an abnormal test
      • Inappropriate (not indicated) care
    • Preventive
      • Failure to provide prophylactic treatment
      • Inadequate monitoring or follow-up of treatment
    • Other
      • Failure of communication
      • Equipment failure
      • Other system failur
  • Medication Use Processes (there are many processes during which an error – or errors – can be made:
    • Prescribing
      • Assessing the need for and selecting the correct drug
      • Individualizing the therapeutic regimen
      • Designating the desired therapeutic response
    • Dispensing
      • Reviewing the order
      • Processing the order
      • Compounding and preparing the drug
      • Dispensing the drug in a timely manner
    • Administering
      • Administering the right medication to the right patient
      • Administering medication when indicated
      • Informing the patient about the medication
      • Including the patient in administration
    • Monitoring
      • Monitoring and documenting patient ’ s response
      • Identifying and reporting adverse drug events
      • Reevaluating drug selection, regimen, frequency and duration
    • Systems and Management Control
      • Collaborating and communicating amongst caregivers
      • Reviewing and managing patient’s complete therapeutic drug regimen


  • Safetysome important differences between accidents in healthcare vs. other industries:
    • in other industries, accidents usually affect worker & company directly (“the pilot is always the first at the scene of an airline accident”), but in healthcare, the damage happens to a third party: the patient
    • in other industries (e.g., airline), large groups can be affected, but in healthcare, it’s usually only one patient being affected at a time (so accidents are less likely to be reported in the media)
  • human error is a big contributor to accidents, but:
    • saying an accident is due to human error is ≠ blaming them
    • when equipment fails, human error can exacerbate the accident
  • Active errors occur at the level of the frontline operator, and their effects are felt almost immediately” (p. 55) (a.k.a.,   the sharp end). 17
  • Latent errors tend to be removed from the direct control of the operator and include things such as poor design, incorrect installation, faulty maintenance, bad management decisions, and poorly structured organizations .” (p. 55) (a.k.a. the blunt end)
  • e.g., “The active error is that the pilot crashed the plane. The latent error is that a previously undiscovered design malfunction caused the plane to roll unexpectedly in a way the pilot could not control and the plane crashed.”
  • latent errors = bigger threat to safety in a complex system because:
    •  often unrecognized
    • can –> many types of errors
  • we often focus on active errors (e.g., fire the person who made the error; retrain the person who made the error), but foucsing on fixing the latent erro would have more of an impact on increasing safety
  • “High reliability theory believes that accidents can be prevented through good organizational design and management. Characteristics of highly reliable industries include an organizational commitment to safety, high levels of redundancy in personnel and safety measures, and a strong organizational culture for continuous learning and willingness to change.” (p. 57)
  • systems are more prone to accidents if they are:
    • complex – since 1 component can interact with multiple other components, if that 1 component fails, all dependent functions also fail; as well, complex systems have multiple feedback loops, so it’s often difficult to predict what’s going to happen if 1 component fails
    • tightly coupled – coupling = “no slack or buffer between two items” (p. 59) – because this usually means there’s only one way to reach a goal and sequences are fixed, can’t “tolerate processing delays, […] reorder[ing of] the sequence of production, […or…] employ alternative methods or resources” (p. 59)
  • healthcare is a complex, tightly coupled sequence (and thus is prone to accidents)
  • “Complex, tightly coupled systems have to be made more reliable. One of the advantages of having systems is that it is possible to build in more defenses against failure. Systems that are more complex, tightly coupled, and are more prone to accidents can reduce the likelihood of accidents by simplifying and standardizing processes, building in redundancy, developing backup systems,” etc. (p. 60)

Human Factors

  • Human factors is defined as the study of the interrelationships between humans, the tools they use, and the environment in which they live and work.” (p. 63)
  • two types of human factors analysis:
    • Critical incident analysis examines a significant or pivotal occurrence to understand where the system broke down, why the incident occurred, and the circumstances surrounding the incident. Analyzing critical incidents, whether or not the event actually leads to a bad outcome, provides an understanding of the conditions that produced an actual error or the risk of error and contributing factors.” (p. 63-4)
    • “ Naturalistic decision making […] examines the way people make decisions in their natural work settings. […} the researcher goes out with workers in various fields, such as firefighters or nurses, observes them in practice, and then walks them through to reconstruct various incidents. The analysis uncovers the factors weighed and the processes used in making decisions when faced with ambiguous information under time pressure” (p. 64)

Error Reporting Systems

  • mandatory reporting systems = for “errors that result in serious patient harm or death (i.e., preventable adverse events)” (p. 87)
  • voluntary reporting systems = for errors that cause no harm/minor harm and “near misses”
  • reporting systems must dedicate sufficient resources to follow up on reports of errors (because the point of reporting systems is to learn from the errors and improve the system to make it safer)
  • reporting systems are known to greatly underreport errors (because most people don’t report errors), so they are not intended to be a “count” of errors
  • voluntary reporting systems need to be non-punitive/protected from legal discovery (as no one will report

Unsafe acts are like mosquitoes. You can try to swat them one at a time, but there will always be others to take their place. The only effective remedy is to drain the swamps in which they breed. In the case of errors and violations, the “swamps” are equipment designs that promote operator error, bad communications, high workloads, budgetary and commercial pressures, procedures that necessitate their violation in order to get the job done, inadequate organization, missing barriers, and safeguards . . . the list is potentially long but all of these latent factors are, in theory, detectable and correctable before a mishap occurs.” (cited on page 155)

Image Credits
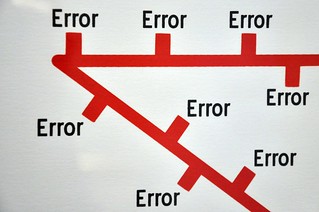
  • multiple errors image – posted on Flickr with a Creative Commons licence
  • safety – posted on Flickr with a Creative Commons license
Posted in healthcare, notes | Tagged , , , , | Leave a comment

What is the “Global Trigger Tool”?

If we want to be able to  make our healthcare system safer, it’s important to be able to identify and measure adverse events – we need to know how much “harm from care” is occurring in our healthcare system and to be able to measure if our efforts are effective in reducing that harm. Relying on voluntary reporting systems of errors and adverse events by healthcare staff, which is how this has traditionally been done, is less than ideal because it requires:

  • staff notice that an error occurred (and given that most errors do not cause adverse events, it’s reasonable that errors might go unnoticed)
  • staff feel safe to report an error or adverse event (which they may not if the culture of the organization is one in which they feel they will be blamed/shamed/punished for the error – there are valid concerns about legal liability (both for the healthcare provider and the organization) and about losing one’s job
  • staff make the effort to report errors or adverse events (which might not be seen as a priority when healthcare staff are busy providing care, especially if they don’t see reports of errors and adverse events being used to improve the system)

Research shows that voluntary reporting captures ~10-20% of errors and that 90-95% of errors do not cause harm (IHI, n.d.).

Since reducing errors is one of the goals of the project I’m evaluating, I’ve been reading up on potential ways to measure errors/adverse events – because how will I know if the project is reducing errors if I can’t measure how many happen, both before and after implementation?

One of the methods I’ve been reading about is “trigger tools”.

  • “Trigger tools” are a method that can be used to identify  adverse events (i.e., harm) and track them over time.
  • 2 approaches (IHI, n.d.):
    1. “monitor the overall level of harm as a dashboard item” – e.g., IHI Global Trigger Tool
    2. “track harm in a specific topic or area” – e.g., IHI Trigger Tool for Measuring Adverse Drug Events 
    • organization-wide measure
    • uses retrospective review of records of adult inpatients in acute care
    • tool includes list of known adverse event “triggers”,  protocol for selecting records, forms for data collection, etc.
    • harm vs. error
      • “medical errors are failures in processes of care and […] have the potential to be harmful”
      • “events of harm are clear clinical outcomes” (IHI, 2009)
      • can be useful to detect and analyze errors (to find ways to improve the system to reduce/mitigate the errors)
      • but looking at harms shifts focus from “individual blame for errors to comprehensive system redesign that reduces patient suffering” (IHI, 2009)
      • IHI GTT’s definition of harm: “unintended physical injury resulting from or contributed to by medical care that requires additional monitoring, treatment, or hospitalization, or that results in death” (IHI, 2009)
        • only includes harm from “active delivery of care (commission)”, not from absence of/”substandard care (omission)”
        • does not include psychological harm
        • does not matter if the harm was deemed preventable or not 1“One could argue that today’s “unpreventable events” are only an innovation away from being preventable.” And since the GTT measures harmful events over time, if you judged events are non-preventable (and thus not counted) now, but the same type of harm as preventable (and thus counted) next year, it would look like an increase in harmful events, when really there was not (IHI, 2009).. “If an adverse event occurred it is, by definition, harm” (IHI, 2009).
        • severity ratings adapted from the National Coordinating Council for medication error Reporting and Prevention Index for Categorizing Errors – except includes only those categories related to adverse events (not errors that did not result in harm) and includes all physical harm, not just medication-related harm
    • process:
      • 2 primary reviewers (with clinical backgrounds and understanding of the hospital records and care processes) review the files independently and then compare their findings to come to consensus
      • physician validates the consensus of the 2 primary reviewers; reviews their notes, not the original records (unless needed) (physician is final arbiter).
      • sampling: 10 patient records randomly sampled from entire population of discharged adults every 2 weeks
        • should be a truly random sample
        • select a few extra records in case one of the ones you chose doesn’t meet criteria (but only review them if that’s the case)
        • in small sites with fewer than 10 inpatients per 2 weeks, review them all
        • can do more, but no added value beyond 40 every two weeks
        • should be discharged more than 30 days prior, as readmission within 30 days is a trigger)
        • retrieve records of hospital admission before and after the index record (but only review to check if trigger is associated with readmission – do not do a full review on the before/after charts)
    • sample size is small, but aggregation over time improves precision
    • chart data on run charts to see patterns over time
    • selection criteria:
      • closed & completed record (all coding done)
      • length of stay at least 24 hrs, formally admitted to hospital
      • age >= 18 years
      • exclude inpatient psychiatric and rehabilitation patients
    • GTT contains 6 modules:
      • Cares and Medications – reflect adverse events anywhere in the hospital
      • Surgical, Intensive Care, Perinatal, Emergency – specific to those departments
    • review record for presence of triggers (don’t need to review entire record) – experienced reviewers have found this order the most useful:
      • discharge codes (esp. infections, complications, certain diagnoses)
      • discharge summary
      • med admin record
      • lab results
      • prescriber orders
      • operative record
      • nursing notes
      • physician progress notes
      • if time permits, other areas of the record
    • no more than 20 mins per patient record (GTT not meant to identify every single adverse event in a record – 20 min rule created because there was a propensity to review shorter records, which biases the data)
    • if trigger noted, review pertinent portions of the record (documented close to the proximity of the trigger) to determine if there was adverse event (not all triggers have an associated adverse event – triggers are just a clue that an adverse event may have occurred)
    • sometimes adverse events will be noted in the absence of a trigger – they still count as adverse events
    • some triggers are, by definition, adverse events (e.g., nosocomial infection, 3rd or 4th decree laceration), so when you see those triggers, you’ve found the adverse event
    • something is an adverse event if it is an “unintended harm from the viewpoint of the patient
    • if an adverse event is present on admission to the hospital, it still counts (remember, it has to meet the definition of “harm related to medical care” – e.g., if medical care at a doctor’s office lead to a harm that cause the patient to go to a hospital – that counts. Record it as such (as it’s useful to know harm that occurred in hospital vs. occurred somewhere else), but the key issue is that this measure is of “what the patient experienced, not what happened in the hospital”
    • when adverse event is identified, assign it a severity level
    • report:
      • report as run charts for:
        1. adverse events per 1,000 patient days
        2. adverse events per 100 admissions
        3. percent of admission with an adverse events
      • report a bar chart of the distribution of harm by category
      • can also report data by type of adverse event (infections, medications, procedural complications) and those that occurred prior to admission vs. present on arrivalIHI Global Trigger Tool

So that’s the Global Trigger Tool. I’ve read about some other studies that measured errors/adverse events, but those will have to be in another blog posting!

Training Resources

References

Footnotes

Footnotes
1 “One could argue that today’s “unpreventable events” are only an innovation away from being preventable.” And since the GTT measures harmful events over time, if you judged events are non-preventable (and thus not counted) now, but the same type of harm as preventable (and thus counted) next year, it would look like an increase in harmful events, when really there was not (IHI, 2009).
Posted in evaluation tools, methods, notes | Tagged , , , , , | Leave a comment

Systems Thinking

I have yet to see any problem, however complicated, which, when looked at in the right way, did not become still more complicated

-Poul Anderson

Systems Thinking is a hot topic in the world of evaluation. I’ve read a fair number of articles that talk about systems thinking (particularly around applying the concepts to evaluation), but figured it was time that I did some dedicated reading on the topic, as I find that sometimes reading secondary sources means that some components get missed or connections aren’t quite clear. The book that I chose to read is Thinking in Systems: A Primer (2008) by Donella H. Meadows (edited by Diana Wright), which was recommended to me *and* which is available online for free from this link. 🙂

Here are my notes from Part 1 – System Structures and Behaviour:

  • “A system is a set of things—people, cells, molecules, or whatever—interconnected in such a way that they produce their own pattern of behavior over time. The system may be buffeted, constricted, triggered, or driven by outside forces. But the system’s response to these forces is characteristic of itself, and that response is seldom simple in the real world.” (p. 2)
  • some implications:
    • “Political leaders don’t cause recessions or economic booms.
      Ups and downs are inherent in the structure of the market
      economy.”
    • “Competitors rarely cause a company to lose market share.
      They may be there to scoop up the advantage, but the losing
      company creates its losses at least in part through its own
      business policies.” (p. 2)
  • We like to break things down into small pieces to try to understand them; we like to draw direct linear cause-and-effect pathways; we want to solve problems by taking action to control the world around us – this is how we are often taught to do things
  • But we grow up in a complex world and learn from experience how these complex systems work
  • Reductionism and systems thinking are complimentary – just like you can see some things with the naked eye and other things with a microscope (and both things exist), reductionism and systems thinking are different ways of looking at things
  • ” A system is an interconnected set of elements that is coherently organized in a way that achieves something” (p. 11): three things a sysmte has:
    • elements
    • interconnections
    • a function or purpose
  • systems are wholes that are more than just the sum of the parts – they have “an active set of mechanisms to maintain that integrity” (p. 12)
  • Systems “may exhibit adaptive, dynamic, goal-seeking, self-preserving, and sometimes evolutionary behaviour” (p. 12)
  • interconnections can be physical flows or flows of information: “signals that go to decisions points or action points within system” (p. 13)
  • functions/purposes even harder to see than interconnections – may not be explicitly stated – sometimes have to watch the system to see how it behaves
    • as well, sometimes systems state a purpose (“this government protects the environment”) but doesn’t behave in a way that works towards that purpose (e.g., puts no money nor effort towards protecting the environment). Basically, actions speak louder than words.
    • most systems have a purpose of “ensur[ing] its own perpetuation” (p. 15)
    • purposes need not be intended by humans and, in fact, the “purpose” of a system might be something that no one in the system actually wants (e.g., society produces crime and drug addiction, which no one wants but which results nonetheless)
    • systems can be nested within other systems = purposes within purposes – and these sub-purposes could conflict with other sub-purposes and/or with the overall purpose. To have a successful system, the system’s purpose and the sub-purposes need to be in harmony
  • changing elements in a system doesn’t change the system that much (e.g., switch all the players on a hockey team and you still have a hockey team) compared to changing the interconnections (e.g., change the rules of hockey to different rules and you’d have a different sport)
  • changing the function/purpose will result in drastic change to the system (e.g., if you changed the hockey team’s purpose from winning to losing)
  • A stock =  “the elements of the system that you can see, feel, count, or measure at any given time” (p. 17) – can be physical (e.g., books in a library, water in a bathtub), but  doesn’t need to be  (e..g., your self-confidence)
  • flow = actions that change stocks (e.g., filling, draining, being born, dying, deposit, withdrawal). “A stock, then, is the present memory of the history of changing flows within the system” (p. 18)
  • dynamic equilibrium: occurs when the inflow = outflow, so level of stock remains constant (even though the “stuff” of the stock is continuously flowing through it)
  • “A stock takes time to change, because flows take time to flow. […] Stocks
    usually change slowly. They can act as delays, lags, buffers, ballast, and sources of momentum in a system. Stocks, especially large ones, respond to change, even sudden
    change, only by gradual filling or emptying.” (p. 23)
  • these time lags can be a problem (e.g., we can’t make things happen as fast as we want them to because it takes time to build factories, create and distribute technologies, educate people to work in those factories and use those technologies), but it can also give us “room to maneuver, to experiment, and to revise policies that aren’t working” (p. 23)
    • don’t expect things to happen faster than they can happen
    • where possible, “use the opportunities presented by a system’s momentum to guide it toward a good outcome” (p. 24)
  • inflows and outflows can be independent of one another (e.g., we don’t have to produce things at the exact rate that we use them) – we have reservoirs for stocks so that we can deal with this (e.g., banks allows us to store money we’ve made until we are ready to spend it. Inventories allow us to produce things at a different rate than the variable rate of customer demand).
  • people make decisions based on stock levels (e.g., inventories too high –> cut prices; money in the bank –> purchase and/or investment decisions about what to do with that money) – this is feedback!
  • feedback loop: “when changes in a stock affect the flows into
    or out of that same stock”
  • balancing feedback loop: works to maintain the stock within a specific range of values; if stock is too high, it works to lower it; if it’s too low, it works to raise it; a.k.a. “goal-seeking or stability-seeking”
  • having a feedback loop does not necessarily mean you’ll reach the target though – there can be any number of reasons why it might fail (e.g., response is too weak, too inefficient, too delayed, don’t have enough resources, don’t have the right information feeding into the feedback loop)
  • reinforcing feedback loops (a.k.a., amplifying, self-multiplying, snowballing, vicious cycles, virtuous cycles): “generates more input to a stock the more that is already there (and less input the less that is already there”; can “cause healthy growth or runaway destruction” (p. 30-31); can occur whenever an element has the “ability to reproduce itself or grow as a constant fraction of itself” (p. 31) – e.g., populations and economies; growth is exponential
    • doubling time: “time it takes for an exponentially growing stock to double in size = 70 divided by the growth rate (as a percentage); e.g., at 7% interest, money in the bank will double in 10 years (70/7 = 10)
  • usually multiple feedback loops occurring at the same time – several loops pulling it in different directions; a flow may fill one stock and drain another
  • dominance: “when one loop dominates another, it has a stronger impact on behaviour” (p. 44) – since systems often have more than one feedback loop, it’s important to think about which one is dominate
  • dominance can shift as flows change
  • systems dynamics models “explore possible futures and ask “what if” questions”‘; “not meant to predict what will happen” (p. 47)
  • questions to test the value of a model:
    1. “are the driving factors likely to unfold in this way?
    2. if they did, would the system react this way?
    3. what is driving the driving factors?”

Some Types of Systems

One Stock Systems

  1. one stock with two competing balancing loops (e.g., a thermostat)
  • when temperature gets too low, heat inflow kicks in
  • when temperature then reaches the set point, heat stops
  • but heat can also be lost to the outside, and that feedback loop is trying to make the room temperature = outside temperature (e.g., if it’s colder outside, the heat will flow to outside and bring down temperature of the room).
  • as the furnace heats the house, it makes the room temperature hotter, which makes a bigger difference between inside and outside, so heat flowing out increases
  • thermostat will make furnace come on, but once it hits the set temperature it goes off, and heat keeps flowing out, so furnace kicks on again (but since it takes time for furnace to kick in, temperature will be a bit below the set point).
  • a well-insulated house will slow the leak of heat outside, which gets the room closer to the set temperature
  • important general principle: “the information  delivered by a
    feedback loop can only affect future behavior; it can’t deliver the information,
    and so can’t have an impact fast enough to correct behavior that drove
    the current feedback” (p. 39)

    •  “there will always be delays in responding” (p. 39)

2. one stock with one reinforcing loop and one balancing loop (e.g., population and industrial economy)

  • e.g.,  —births—> [population]–deaths–>
    • if fertility = mortality, population stable
    • if fertility > mortality, population grows exponentially
    • if fertility < mortality, population dies off
  •  e.g. economy
    • —investment—>[capital stock]—depreciation—>
    • the greater the stock of capital (e.g., factories, machines) and the greater the efficiency of production (i.e., output of goods/services per unit of capital), the greater the output of goods and services (and thus capital increases – reinforcing loop)
    • but things wear out and become obsolete – the faster this happens, the shorter the lifetime of the capital
    • if investment > depreciation (as it has been of late), economy grows
  • “systems that have similar feedback structures produce similar dynamic behaviors, even if the outward appearance of the systems is completely dissimilar” (p. 51) – e.g., even though the economy and population look very different, they both have a reinforcing loop with a balancing loop

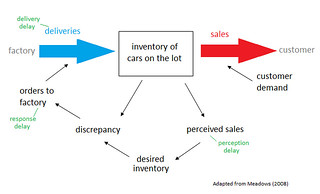
3. a system with delays – e.g., business inventory

system with delays

  •  e.g., there is an inflow of deliveries from the factory and outflow of sales
  • car dealer wants to maintain a consistent amount of inventory to both have enough cars on hand for the expected sales, plus some buffer because car sales are unpredictable on a day to day basis
  • perception delay: the car dealer monitors sales and when they see to be changing, changes order; takes a few days to determine if the change is normal fluctuation or an actual trend
  • response delay: doesn’t make the whole change at once – e.g., orders 1/3 of the increase with each of the next 3 orders (again, just to make sure it’s a real trend)
  • delivery delay: how long it takes factory to make & deliver the extra cars; not in the control of the dealer
  • without any delays, if you saw a 10% increase in perceived sales, you’d up orders by 10% and shift to a new inventory levels that is 10% higher
  • but with delays, you get oscillations (e.g., perception delays –> inventory drop as you are selling more cars then expected but haven’t yet replaced them and increased order to make up new sales; delivery delay means inventory continues to drop, so you order more, but then when they come in, your inventory ends up over, and then the same thing happens over again – oscillations)
  • dealer doesn’t have timely information to make decisions and physical delays mean she can’t have an immediate effect for an action she takes
  • one might think that since delay is the problem, then shortening her reaction time would mitigate the oscillations, but it actually increases oscillations, because she’s overreacting
  • people often have counterproductive idea of what “policy lever” to pull and in what direction to pull it, to get the desired effect in the system
  • delays are common in systems and “changing the length of a delay may (or may not, depending on the type of delay and the relative lengths of other delays) make a large change in the behavior of a system” (p. 57)
  1. A Renewable Stock Constrained by a Non-renewable Stock – e.g., an Oil Economy
    • previous examples did not include constraints (so we could look at the dynamics in a simple way), but in reality there are always constraints (given a finite environment – the inflows have to come from somewhere and the outflows have to go to somewhere)
    • can have resource constraints and/or pollution constraints
    • constraints can be renewable or non-renewable
    • limits can be temporary or permanent
    • eventually there must be some accommodation (e.g., system adjust to the constraint, the constraint adjusts to the system, or both)
    • when the resource stock is nonrenewable, like oil, it means that as you deplete the resource stock, it gets harder and harder to get the next unit of oil, so more capital is required to extract it
    • at the start, you have high profit, so invest in more capital, so you extract more oil, which depletes the resource stock, which in turn makes it most costly to extract more oil, which decreases your profit – eventually you get to the point where you can no longer make a profit by extracting the remaining oil, so you leave it in the ground
    • you can decrease the rate of growth, which will extend the time to depletion (you can get rich quickly or get less rich, but for longer)
    • if price of the resources goes up or if technology decreases operating costs (e.g., new technology to get oil out of the ground for cheaper) will also delay how long it takes before it’s no longer profitable to extract the remaining oil

5. A Renewable Stock Constrained by a Renewable Stock – e.g. Fishing Economy

renewable stock constrained by renewable stock

  • like the previous, except that the input is renewable (e.g., fish can produce more fish; or sunlight, which is constantly replenished).
  • the more scarce the resource, the more costly it is to harvest it (e.g., fewer fish require bigger boast to go farther to catch them, more expensive sonar technology to find them)
  • regeneration rate of fish is dependent on fish density
    • very high fish density – less reproduction (limited by food and habitat
    • as fish density decreases, reproduction rate increases, until it hits some maximum
    • after that point, when fish density get low enough, reproduction rate falls (as density is so low that fish can’t easily find each other or other fish more into their habitat
  • three non-linear equations govern this simplified model of a fishing economy
    • price (more scarce fish = more expensive)
    • regneration rate (less reproduction at very high or very low density)
    • yield per unit of captical (efficiency of fishing technology/practices)
  • “this system can produce a number of different sets of behaviours” (p. 67)
    • e.g., fish population increases, fishing increases until the population becomes so low that it’s not economically viable to continue to grow the industry –> fishing levels decrease to the point that we have a sustainable equilibrium
    • e.g. 2, fish population increases, fishing increases and develops technology to increase efficiency such that they overshoot equilibrium point and then oscillation occurs around that point (instead of a steady equilibrium)
    • e.g. 3, fish population increases, fishing increases and develops such good technology to increase efficiency such that they overshoot equilibrium point to the point that they have a near complete wipeout of the population and the industry collapses
    • sometimes there is enough of the population left that, once industry collapses, they can repopulate and the whole cycle can repeat (e.g., forestry)
    • however, whether a renewable resource can bounce back depends on what happens during the time when it is depleted – e.g., a small population of fish might be displaced by other species, or lack sufficient genetic diversity to flourish or be vulnerable to pollution or storms
    • also depends on how fast and effective the balancing feedback loop is to stop capital growth
  • “The trick, as with all the behavioral possibilities of complex systems, is to recognize what structures contain which latent behaviors, and what conditions release those behaviors—and, where possible, to arrange the structures and conditions to reduce the probability of destructive behaviors and to encourage the possibility of beneficial ones” (p. 72)


Posted in notes | Tagged , | Leave a comment

Complexity of EHR implementation and evaluation design

As I’ve mentioned, I’m currently developing an evaluation for the implementation of an electronic health record (EHR) system. Specifically, this project crosses multiple healthcare organizations, will be implemented in dozens of healthcare facilities run by those organizations, and will be used by tens of thousands of clinicians from all disciplines as they provide care for hundreds of thousands 1Millions? of patients. So, you know, easy peasy, right?

Let's have some complexityThroughout my career as a program evaluator in healthcare, I’ve seen first hand that healthcare is a complex sector. There are a multitude of interacting actors – clinicians of all sorts of different disciplines (all with their own scopes of practice, standards, regulations, cultures, and expertise), administrators who plan services/allocate resources/run facilities/etc., government mandates to be dealt with, emerging research evidence and health technologies to translate to practice, patients with every sort of health issue imaginable (not to mention their complex social, psychological, economic, and various other facets of their lives), critical privacy and security issues to be managed – and nothing less is at stake than the health and well-being of all of our patients/clients/residents. But this project is, by far, the most complex project I’ve ever seen. Not only is it working to create and deploy a new electronic health information technology (technology is complex)  for all of the healthcare professions (another layer of complexity), but it’s bringing together three separate health organizations, each with their own current processes, varying technologies, and different cultures. It’s a multi-year, multi-site project, so from an evaluation perspective, there are considerations around when different sites “go live” with the new system, what systems they had in place prior to “go live”, and what else is going on in the environment during this lengthy implementation period.

So how, exactly, does one go about evaluating such an initiative? Some of the immediate ways of evaluating if this new program “works” have some obvious flaws:

  • Randomized controlled trial. Some people will suggest that if you want to know if something works, you need to do an RCT. Now, this is a great way to determine if, say, a new drug works – randomize people to get either the drug or a placebo 2Or usual care, if a current treatment exists. and see if the drug works better. But a health information technology is not like a drug – it’s far more complex than that. In addition to the complexity, there are pragmatic reasons why RCTs wouldn’t work well – the hospitals/facilities in which the technology will be implemented are not similar enough to truly serve as controls for one another. We have big hospitals, little hospitals, rural/remote facilities, specialty hospitals. As well, there’s no way to blind a site as to whether or not they have a new electronic health record or not!
  • Compare our implementation to a comparator site. There really aren’t any truly comparable sites. There are many, many ways to implement an electronic health record and to find another project that is comparable to ours (e.g., standardization across multiple health organizations in dozens of facilities of varying size/acuity/geography, implementing the specific applications we are (and not implementing the ones we are not), implementing “big bang” (all applications introduced at the same time in a given site) vs. incrementally (implementing one application at a time), with patient populations similar to our, and with staff populations similar to ours, in a Canadian setting, at a similar point in history) would be impossible.
  • Pre-post. Using a given site’s own data as baseline – this is getting closer to something that we can do. Of course, with this type of evaluation, we will need to collect data on the context of each go live, including what systems are in place at baseline and other changes are occurring at the same time as our implementation that may affect the outcomes of interest. So it will be difficult, if not impossible, to ascribe attribution (i.e., our project definitely caused outcome X to occur).

In the interest trying to figure out how best to plan the evaluation, I have taken a look at the literature. After all, we are not the first place to implement an electronic health record, so why not learn from those who have gone before us? As I’ve been reading, I’ve be reassured by all of the authors who are stating similar things to what I’ve been thinking: this is an extremely challenging type of project to evaluate! Next, I present some of the key points from the articles I’ve read so far.

Building A House on Shifting Sands

  • article by the evaluation team tasked with evaluating the UK’s National Health Service’s project to implement a national electronic health record
  • “most EHR evaluations draw upon a broadly positivist ontology and pursue causality in term[s] of an intervention’s impact and by making objective judgements concerning the outcomes and hence degree of success or failure of such initiatives” (p. 106)
  • designs like RCT and pre-post “if pursued in isolation runs the risk of over-simplifying the dynamic complexity of large-scale technology-led projects […] The issues of context found in large-scale projects cannot be ‘controlled’ by traditional research design alone, but have to be embraced and actively incorporated into evaluation” (p. 106)
  • “we see national EHR endeavours not as programs composed of essentially discrete ICT [information & Communication Technology) ‘projects’, dissociated from policy, technology, service delivery and clinical work. Rather we see the need to incorporate these elements in evaluation as inextricable parts of EHR programs, including the constantly changing parallel polices and strategies, complex and evolving software ecologies and diverse health care working practices, all of which interact across their porous boundaries.” (p. 106)
  • two principles they emphasize:
    • “the malleable character of any EHR program as it is shaped by contextual forces and is reinterpreted by various interest groups and people”  (p. 106)
    • “the need for evaluators to draw upon alternative perspectives and understandings of technology and the possible role of information  and data in changing work practices and organizational structures and hence potential to affect specific outcomes” (p. 106)
    • “these two fundamental ideas are both ontological (i.e., concerned with the assumptions made as to the nature of the reality we study) and epistemological (i.e., concerned with how we obtain valid information about that reality” (p.106)
  • they originally planned a stepped wedge design
  • some challenges:
    • only had 30 months to study (not long enough to capture longer-term outcomes)
    • they where implementing different software systems at different sites (e.g., different mixes of functionalities), so difficult to compare sites
    • designed the evaluation based on the belief that there was clear “before”, “during”, and “after” implementation periods, which, though different at different sites, would be “broadly comparable in other respects (e.g., approach to training, changeover strategy, resources available, objectives set)” (p. 108)
  • they discovered that some of their assumptions were questionable
  • found that “implementation was highly context-bound” and so “direct comparisons or summations across the various Trusts experiences and their implementation stages would risk losing much of the valuable local detail if standard measures for comparison were abstracted away form the rich and complex causal environments found in each site” (p. 5)
  • there wasn’t a clear distinction between absence of the system (before) and implementation of the system (during and after) – there was lots of work that had to be done locally/interim software solutions/etc. that made the boundaries fuzzy.
  • because of geographical and institutional distribution, the evaluators couldn’t always be where the action was, so some thing would have been missed
  • difficult to account for the Politics and the politics involved
  • “principal insights gained into evaluation of large-scale EHR programs” (p. 111):
    • EHR programs are inherently political
    • EHR programs exist in a dynamic environment
    • “sociotechnical intervention that is given meaning through the activities of its implementation and adoption” (p. 111)
    • need evaluation by “studying changing as it occurs, rather than just by measuring achieved change (desired outcomes)” (p. 6)
    • pre-post design alone “may miss vital information about the change process, and assume that there is a clear definition of “after””(p. 6)
    • study “what people do, and in particular, how, and to what extent, they ‘work to make it work'” (p. 6)
    • evaluations “focused on changing narrate the system change and tell the story of EHR implementation and adoption through multiple voices” (quite different than just evaluating the outcome )
    • case studies can “probe deeper and address EHR systems within dynamic or distinction socio-cultural environments”
    • “multiple co-ordinated case studies allow an insightful cross-site dialogue that can reveal common themes and distinct experiences” (p. 6)
    • “the evaluators’ role is to be part insider and in part an outsider; understanding but also questioning” (p. 6)
  • evaluators needed to be adaptive to the shifting sands
  • “our approach […] became more and more one that focused on the activity ‘in between’; the period during which things (and people, and teams) were changing , rather than some end state of achieved and stabilised change.” (p. 111)
  • focus became “understanding and narrating the stories of a network of NHS CRS in-the-making” … “we saw that greater insights could be gained from approaches that sought to ‘tell the whole story’ not just the ending.” (p. 111)
  • they found that “the direct functionalities that [conventional driving forces for EHR: error, safety and quality of care] depended on were mostly unimplemented in the sites we studies within our timeframe” (p. 112)
  • “our sociotechnical lens was in particular focused on the specific question of how things were ‘made-to-work’ rather than on how well or not the EHR systems functioned.” (p. 113)
  • “from this perspective, non- or partial adoption, mis-use , non-use and workarounds are not simply negative effects, pathologies or signs of failure, but are different enactments of the ‘technology-in-use’. Over a period of time, they may chart the necessary path to a successful national EHR service” (p. 113)
  • “there is no single, or standard way of best implementing national and large-scale EHR systems, and so too there is no predefined and prescriptive strategy to evaluate them” (p. 113)

Evaluating eHealth Interventions: The Need for Continuous Systematic Evaluation

  • this essay “argues for continuous systematic  multifaceted evaluations – throughout the life cycle of eHealth interventions – on the grounds that such an evaluative approach is likely to provide timely and relevant insights that can help to assess the short-, medium-, and long-term safety, effectiveness and cost-effectiveness of eHealth interventions” (p. 1)
  • many different phrases used to describe sharing of health data using technology- e.g., “ICT” = information communications technology”, or “health IT” or “EHR” or “EMR” (also health portals and telemedicine interventions
  • the phrase “eHealth should encompass the full spectrum of ICTs, whilst appreciating the context of use and the value they can bring to society” (p. 2)
  • Pagliaris defined eHealth as “an emerging field of medical informatics, referring to the organization and delivery of health services and information using the Internet and related technologies. In a broader sense, the term characterises not only a technical development, but also a new way of working, an attitude, and a commitment for networked, global thinking, to improve healthcare locally, regionally and worldwide by using information and communication technology.” (quoted on p. 2)
  • anticipated benefits of eHealth:
    • reduce costs/improve efficiency
    • reduce medical errors
  • however, these haven’t been “empirically demonstrated”
  • we also have to consider the risk of potential harms that could be caused by eHealth (e.g., poorly designed or hard-to-use systems could cause errors; security/privacy risks; money put into eHealth systems may be diverted from other needs in the system)
  • need to map out a “chain of reasoning” that from the problem/need to the solution [this is essentially what we are doing with our logics model on my project]
  • “studies adopting an experimental design approach fail to take sufficient account of the contextual considerations, which play a major role in the success for failure of the intervention being studied” (p. 3)
  • the model proposed in this paper focuses a lot on the development of the solution/application and how to evaluate in that time. It does mention formative and summative evaluation during the “implement and deploy” phase
  • my scope is to evaluate the implementation of the system once it is built (we have processes in place to do things like build/test/iterate/end-user test within the project to create our system, but that’s no within my scope)

Evaluating eHealth: How to Make Evaluation More Methodologically Robust

  • 4 tricky issues:
    • which research methods are suitable to evaluate highly complex interventions with diffuse effects?
    • is it necessary to make observations at both the patient and system level?
    • formative or summative evaluations?
    • internal or external evaluators?
  • this paper suggests:
    • “methodological pluralism” – both quantitative and qualitative methods
      • quant – info on how the IT system is performing, helps build theories needed to understand how interventions work (not just if they work in this one instance), which allows for generalizability
      • qual – can provide information on why things work/don’t work; can “contribute to parameter estimation, particularly under a Bayesian framework” (p. 2)
    • “primary unit of analysis in evaluation of IT systems is likely to be at the organisational/workgroup level (e.g., wards, hospitals, practices)” (p. 2)
    • IT can affect many levels in the organization, can have many effects (both good and bad) – you need to study all the levels!
    • you also need to collect data along all the points along the “causal chain” so you know not just what happened, but why it happened
    • this can help you to “generate theories about possible explanation and remedies” (p. 2)
    • ultimately, we are interested in positively affecting patients
      • service level improvements “may be necessary, but not necessarily sufficient, conditions for a positive impact at the patient level” (p. 3)
    • baseline observations are needed to put things into context
    • you need multiple measurements to model cost-effectiveness/cost-benefit
    • effects on morbidity/mortality may not be able to be shown (not specific enough)
    • important to collect error rates and clinical process data when possible
    • one challenge with IT is that “intervention and measuring system are not necessarily independent”(p. 3)
    • formative evaluations can be fed back into implementation – that will affect the summative results – important to keep this in mind if you are generalizing (e.g., if future implementations don’t include formative evaluation, they might not get as good of results as your project that did include formative evaluation)
    • so it’s important to document when formative results are fed back into implementation and what affect they have
    • they suggest that external evaluators can “add value” to work of internal evaluators (e.g., they “can provide expertise in the measurement of endpoints” (p. 3), they may have more “credibility” because they are independent of the implementation)

Evaluating eHealth: Undertaking Robust International Cross-Cultural eHealth Research

  • eHealth applications are generally local or regional (with a few national projects) – we are missing out on the potential to share learnings
  • challenges to collaborating on evaluations cross-culturally – lack of standardization, experiences not being shared, languages, literacy (especially in developing countries), cultural/societal differences, differences in clincial systems/workflows and how health sysmtems are organized
  • suggestions to facilitate international eHealth evaluation
    • promote importance of evalution of eHealth
    • standards/coherence on description the intervention (so many ways that eHealth can be done and reports often don’t describe exactly what was implemented)
    • agreement on common outcome measures
    • improve reporting, indexing, and systematic review of eHealth literature

Why Do Evaluations of eHealth Program Fail? An Alternative Set of Guiding Principles

  • this paper responds to the previous three papers, which approach evaluation from a “positivist” set of assumptions:
    • “there is an external reality that can be objectively measured;
    • phenomena such as “project goals”, “outcomes”, and “formative feedback” can be precisely and unambiguously defined;
    • that facts and values are clearly distinguishable;
    • that generalizable statements about the relationship between input and output variables are possible” (p. 1)
  • other approaches based on different philosophical assumptions:
    • “”interpretivist” approaches assume a socially constructed reality (i.e., people perceive issues in different ways and assignment different values and significance to facts) – hence reality is never objectively or unproblematically knowable – and that the identity and values of the researcher are inevitably implicated in the research process
    • “critical” approaches assume that critical questioning can generate insights about power relationships and interests and that one purpose of evaluation is to ask such questions on behalf of less powerful and potentially vulnerable groups (such as patients)” (p. 1)
  • these alternative philosophical approaches “reject the assumption that a rigorous evaluation can be exclusively scientific” (p. 1)
  • in addition to the “scientific agenda of factors, variables, and causal relationships, the evaluation must also embrace the emotions, values, and conflicts associated with the program.  eHealth “interventions” may lie in the technical and scientific world, but eHealth dreams, visions, policies, and programs have personal, social, political, and ideological components, and therefore typically prove fuzzy, slippery, and unstable when we seek to define and control them” (p. 1)
  • problems with using exclusively scientific approach to evaluating eHealth program:
    • there are multiple goals
    • not everyone agrees on the goals
    • thus it is difficult to measure the project’s “success” in achieving its goals
    • outcomes aren’t stable – they change over time, differ across contexts
    • so many intervening variables between process –> outcome that it is impossible to attribute causation to the process (e.g., in one of the author’s projects, they identified 56 interventing variables!!)
    • “key characteristics of program success may not be articulated in the vocabulary of outcomes and any not yield to measurement”
    • if a program adapts to what it learns as it goes and that takes it away from the original objectives, it will be called a “failure” on those original objectives (need to be able to step back and ask if that’s really a failure or if the project succeeded in other ways instead)
    • reducing things to “abstracted variables” (e.g., IT response time, morbidity, mortality) “may remove essential contextual features that are key to explaining the phenomenon under study. Controlled, feature-at-a-time comparisons are vulnerable to repeated decomposition: there are features within features, contingencies within contingencies, and tasks within tasks” (p. 2)
  • “When we enter the world of variables, we leave behind the ingredients that are needed to produce a story with the kind of substance and verisimilitude that can give a convincing basis for practical action”  “Substance” (conveying something that feels real) and “verisimilitude” (something that rings true) are linked to the narrative process, which Karl Weick called “sensemaking”, which is essential in a multifaceted program whose goals are contested and whose baseline is continually shifting.” (p. 2)
  • “Collection and analysis of qualitative and quantitative data help illuminate these complexities rather than produce a single “truth”” (p. 2)
  • narrative “allows tensions and ambiguities to be included as key findings, which may be preferable to expressing the “main” findings as statistical relationships between variables and mentioning inconsistencies as a footnote or not at all” (p. 2)

journal.pmed.1000360.t001

  • in contrast to Lilford et al’s 4 “tricky” issues (mentioned above), these authors argue that “the tricky questions are more philosophical and political than methodological and procedural” (p. 3)
  • they offer an “alternative and […] provisional set of principles” which are intentionally abstract/general so they can be applied to a variety of contexts/settings
  1. role of the evaluator: strike a balance between critical distance and immersion/engagement (“Ask questions such as What am I investigating—and on whose behalf? How do I balance my obligations to the various institutions and individuals involved? Who owns the data I collect?”) “ The dispassionate scientist pursuing universal truths may add less value to such a situation than the engaged scholar interpreting practice in context”
  2. governance process: broad-based advisory, independent chair, “formally recognises that there are multiple stakeholders and that power is unevenly distributed between them”
  3. “provide the interpersonal and analytic space for effective dialogue” (“Conversation and debate is not simply a means to an end, it can be an end in itself. Learning happens more through the processes of evaluation than from the final product of an evaluation report”)
  4. emergent approach: don’t set the evaluation plan and then follow it religiously regardless of what happens – plan needs to grow/adapt in response to findings and practical issues; “build theory from emerging data”)
  5. “consider the dynamic macro-level context (economic, political, demographic, technological)
  6. “consider different meso-level contexts (e.g., organisations, professional groups, networks), how action plays out in these settings (e.g., in terms of culture, strategic decisions, expectations of staff, incentives, rewards) and how this changes over time. Include reflections on the research process (e.g., gaining access) in this dataset”
  7. “consider the  individuals […]through whom the eHealth innovation(s) will be adopted, deployed, and used”
  8. “consider the eHealth technologies, the expectations and constraints inscribed in them (e.g., access controls, decision models) and how they “work” or not in particular conditions of use. Expose conflicts and ambiguities (e.g., between professional codes of practice and the behaviours expected by technologies)”
  9. narrative as an analytic tool and to synthesise findings. Analyse a sample of small-scale incidents in detail to unpack the complex ways in which macro- and meso-level influences impact on technology use at the front line. When writing up the case study, the story form will allow you to engage with the messiness and unpredictability of the program; make sense of complex interlocking events; treat conflicting findings (e.g., between the accounts of top management and staff) as higher-order data; and open up space for further interpretation and deliberation.
  10. critical events in the evaluation itself: “Document systematically stakeholders’ efforts to re-draw the boundaries of the evaluation, influence the methods, contest the findings, amend the language, modify the conclusions, and delay or suppress publication.”

There’s a tonne more literature on this topic 3And I haven’t really even gotten to bringing together my own thoughts on all of this – so far it’s just notes from the papers themselves., but this blog posting is already crazy long, so I think I’ll end this one here. But you can expect more on this topic soon!

References:

Bates DW, Wright A. (2009). Evaluating eHealth: Undertaking Robust International
Cross-Cultural eHealth Research. PLoS Med 6(9): e1000105 (full text)

Catwell, L, Sheikh, A. (2009). Evaluating eHealth Interventions: The Need for Continuous Systematic Evaluation. PLoS Medicine. 6(8): e.10000126 (full text)

Greenhalgh, Trisha, Russell, Jill. (2010). Why do evaluations of eHeath Programs Fail? An Alternative Set of Guiding Principles.  PLoS Med 7(11): e1000360. (Full-text)

Lilford RJ, Foster J, Pringle M. (2009) Evaluating eHealth: How to Make Evaluation More Methodologically Robust. PLoS Medicine. 6(11): e. 1000186 (full text)

Takian A, Petrakaki D, Cornford T, Sheikh A, Barber N. (2012). Building a house on shifting sand: methodological considerations when evaluating the implementation and adoption of national electronic health record systems. BMC Health Serv Res. 12:105.(full text)

Image Credits:

“It’s not that simple” sign – Flickr with a Creative Commons license by futureatlas.com.

Footnotes

Footnotes
1 Millions?
2 Or usual care, if a current treatment exists.
3 And I haven’t really even gotten to bringing together my own thoughts on all of this – so far it’s just notes from the papers themselves.
Posted in evaluation, healthcare, information technology, methods, notes | Tagged , , , , , , , , , | Leave a comment

Informatics, Big Data, and Data Visualization

Notes from module 10 of the Interprofessional Health Informatics course I’m working on (plus side reading that I did to fill in some blanks/learn more about some things mentioned in the course).

  • Big Data = size of a database that is too large to manipulate with traditional methods
  • there are terabytes and terabytes of patient data being collected
  • data is also collected from instruments, devices, sensors, social media, mobile technologies, etc.
  • see notes re: eScience
  • methods: data mining, data visualization – helps you generate hypotheses from the data
  • neural networks – e.g., can help with pattern recognition
  • 3 big projects:
  1. Exploring and Understanding Adverse Drug Reactions project
    • computer system to detect ADE
    • EHRs in 4 EU countries
    • analyzing the EHRs for signals, combos of drugs & AEs
  2. Exploring the Frontier of EHR Surveillance: The Case of Postop Complications
    • data mining
  3. MetroHealth
    • replicated Norwegian study of heart disease risk by data mining EHRS
    • 3 months (vs. 13 years) and gave more precise results
  • eScience Challenges
    • how do we codify and represent our knowledge?
    • ontologies provide common scheme on how to organize, reorganize, and share data
  • digital infrastructure for data capture, standardized data elements and transfer, data analysis, dissemination, and research funding is all need
  • ontology-based search – allowed by structured data

Data Visualization

  • these 4 sets of data ((which I Googled and found are knowns as “Ansombe’s quartet“) have identical statistics (i.e., the mean and standard deviation of x is the same for all 4, the mean and standard deviation of y is the same for all 4 sets)
 
I II III IV
x y x y x y x y
10.0 8.04 10.0 9.14 10.0 7.46 8.0 6.58
8.0 6.95 8.0 8.14 8.0 6.77 8.0 5.76
13.0 7.58 13.0 8.74 13.0 12.74 8.0 7.71
9.0 8.81 9.0 8.77 9.0 7.11 8.0 8.84
11.0 8.33 11.0 9.26 11.0 7.81 8.0 8.47
14.0 9.96 14.0 8.10 14.0 8.84 8.0 7.04
6.0 7.24 6.0 6.13 6.0 6.08 8.0 5.25
4.0 4.26 4.0 3.10 4.0 5.39 19.0 12.50
12.0 10.84 12.0 9.13 12.0 8.15 8.0 5.56
7.0 4.82 7.0 7.26 7.0 6.42 8.0 7.91
5.0 5.68 5.0 4.74 5.0 5.73 8.0 6.89
  • for all 4 sets:
    • mean of x = 9
    • mean of y =11
    • variance of x = 7.50
    • variance of y =4.12
    • correlation between x and y  = 0.816
    • linear regression equation  = y = 3 + 0.5x
  • so they are “statistically identical” but when you graph them, you see they are quite different!

Anscombe's quartet 3.svg
Anscombe’s quartet 3” by Anscombe.svg: Schutz
derivative work (label using subscripts): Avenue (talk) – Anscombe.svg. Licensed under CC BY-SA 3.0 via Commons.

  • data visualization isn’t new:
    • e.g., John Snow’s cholera map; Florence Nightingale did lots of graphs
  • reading visualizations:
    • Perception: low-level activity of sending the visual aspects of a day
    • Cognition: the higher-level process of interpreting the display and translating it into meaning
    • The challenge: using what we know about perception and cognition to make visualizations better
  • research has been done on which things we can perceive more quickly (e.g., comparing things along a 2D line is quicker than comparing areas of a shape which is quicker than comparing volume of a 3D object)
  • cognitive burden – how hard is it for us to interpret the data (e.g., extract values, compare values, detect trends)
  • when creating data visualizations, we should make the images easiest to perceive and we should match the method of visualization with its purpose
    • e.g., if you need to extract an exact value, use a table; but if you need to detect a trend in the data, use a line graph (if you want to get an exact value, it’s harder to do from a graph)
  • key point: there isn’t one best way to display data – it depends on the purpose
  • some tasks may require combinations
  • many published guidelines with different aims
    • persuasive graphs
    • statistical graphs
  • there is no general theory of data visualization
  • suggested practices (general):
    • for value extraction: table
    • for proportions: pie charts, stacked bar charts
    • for value comparison: bar charts, line graphs, scatterplots
    • tended detection: line graphs
    • use the design which minimized the cognitive burden for the task at hand
  • 3 questions to ask when designing a visualization:
    • who is the intended audience?
    • what is the goal? (e.g., exploration, education, persuasion)
    • what are the data composed of, statistically? (e.g., continuous, categorical, time series)
  • in addition to the graphs we commonly use (line graph, bar chart), there are some other types of graphs:
  • a streamgraph: “a type of stacked area graph which is displaced around a central axis, resulting in a flowing, organic shape.” (Wikipedia)
LastGraph example.svg “LastGraph example” by PsychonautOwn work. Licensed under CC0 via Commons.
  • a sunburst graph: “used to visualize hierarchical data, depicted by concentric circles” (Wikipedia)
Disk usage (Boabab).png
Disk usage (Boabab)” by w:Baobab (software). Licensed under CC0 via Commons.
  • you do a lot with simple tools like Excel, but there is also more advanced software to do even cooler things:
    • e.g. Tableau is a software (costs money) that makes it easy to do data visualization; it uses knowledge of best practices of data visualization to suggest what to do; it’s quite expensive, requires some training
    • e.g., ggplot2 for R (free) – builds on basic graphing in R and allows you do to stuff more easily; very sophisticated graphs
    • d3js.org – JavaScript library for manipulating documents based on data (allows you to make your graphics interactive and plug it right into your website) (free)

And with that, I’ve completed my first ever Coursera course!

Posted in data analysis, evaluation tools, healthcare, information technology, notes, online module notes, research | Tagged , , , , , , , , , , , , , , | Leave a comment

Health Information Exchange

Notes from module 9 of the Interprofessional Health Informatics course I’m working on (plus side reading that I did to fill in some blanks/learn more about some things mentioned in the course).

Interoperability

laptop and stethoscope

  • Interoperability: “the ability of two or more systems or components to exchange information and to use the information that has been exchanged” (IEEE Standard Computer Dictionary)
  • exchange – information transported
  • interoperability – semantic tools needed to make sure that you can use the information once you get it!
  • interprofessional opportunity – disparate services can be integrated – data standards are critical
  • we need common terminologies to enable meaningful information exchange across professions

Standardization

  • “continuously learning health system” vision –  we will learn from the system and apply those learnings to the system
  • USA Federal health IT strategic plan: better technology –> better information –> transform healthcare
  • essential data sets (nursing as an example, but other professions have these as well)
  • purpose: meet information needs of multiple users (e.g., clinicians, patients, administrators, payers)
  • minimum, core, essential data to capture the care experience
  • enable the collection, management, manipulation and communication of data for multiple purposes
    • Nursing Minimum Data Set (NMDS)
    • 16 essential elements in 3 broad categories
      • nursing care elements – nursing dx, nursing intervention, nursing outcomes, intensity of nursing care
      • patient or demographics – personal ID, DOB, sex, race/ethnicity, residence
      • service elements – facility, unique patient number, unique number of principal RN provider, episode admission or encounter data, discharge/termination data, disposition of pat, expected payer for the bill
      • Nursing Management Minimum Data Set    (NMMDS)
        • essential data for support administration and management of nursing care delivery across multiple settings
        • 18 elements in three broad categories
          • environment: unit/service, type of unit/service, patient population, volume of delivery, accreditation, decisional participating, unit/service complexity, patient accessibly, method of care delivery, complexity of clinical decision making
          • nursing care: manager demographic profile, nursing staff & client care support personnel, nursing care staff demographic profile, nursing care staff satisfaction
          • financial resource: payer type, reimbursement, unit/service budget, expenses
      • International Nursing Minimum Data Set (I-NMDS)
        • NMDS and NMMDS were created in the US
        • wanted to know if they’d be applicable globally
        • International Council for Nurses and International Medical Informatics Association working together
        • Established NMDSs (Australia, Canada, Belgium, Iceland, Switzerland, Thailand & Netherlands)
        • Emergent NMDS: Nordic countries, Brazil, UK, etc.
        • core variables: patient problem/phenomenon, interventions, and outcomes, plus nursing resource, are in the international set
        • focused on core data that, if every country collected it, we’d be able to work together
        • want to work towards best use of nursing resource, best care and patient/family experience
  • Logical Observation Identifiers Names and Codes (LOINC(R))
    • originally for lab, but NMMDS is being coded to be included in LOINC
  • to be able to collect the minimum data set data, you need classifications/vocabularies/terminologies (recall from module 3)
  • we want data from multiple agencies and vendors to be integrated
  • we want to be able to link interventions and outcomes

Resource: An IT Primer for Health Information Exchange

Image Credit: Posted by jfcherry on Flickr using a Creative Commons license.
Posted in healthcare, information technology, notes, online module notes | Tagged , , , , , , , , , , , , , , , , , | Leave a comment

Informatics and Ethics

Notes from module 8 of the Interprofessional Health Informatics course I’m working on (plus side reading that I did to fill in some blanks/learn more about some things mentioned in the course).

  • “knowledge is power” – Sir Francis Bacon, 1597
  • we should use data, information, and knowledge ethically
  • each profession has its own code of ethics – how does it relate to informatics?
  • principles of information ethics:
    • respect for information property
    • respect for privacy
    • fair representation
    • non-maleficence
  • International Medical Informatics Association (IMIA) Code of Ethics for Health Information Professional
    • fundamental ethics principles
      1. autonomy (“all persons have a fundamental right to self-determination”)
      2. equality and justice (“all persons are equal as persona and have a right to be treated accordingly”)
      3. beneficence (do good)
      4. non-malfeasance (do no harm, prevent harm)
      5. impossibility (“all rights and duties subject to the condition that it is possible to meet them under the circumstances that obtain”).
      6. integrity (fulfill your obligation to the best of your ability)
    • general principles of informatics ethics:
      1. information-privacy and disposition (“all persons have a fundamental right to privacy, and hence to control over the collection, storage, access, use, communication, manipulation, and disposition of data about themselves”)
      2. openness (you should know when data is collected/stored/etc. about you)
      3. security (data should be protected)
      4. access (you should have access to data about you and the right to correct it)
      5. legitimate infringement (“The fundamental right of control over the collection, storage, access, use, manipulation, communication and disposition of personal data is conditioned only by the legitimate, appropriate and relevant data-needs of a free, responsible and democratic society, and by the equal and competing rights of other persons.”
      6. least intrusive alternative (infringement on privacy rights and right to control your own data “may only occur in the least intrusive fashion and with a minimum of interference with the rights of the affected person”)
      7. accountability (infringement on privacy rights and right to control your own data “must be justified to the affected person in good time and in an appropriate fashion”
    • all of the above quotations come from the code, which is linked to above)
    • the code also lists a bunch of duties of health information professional
  • information in an EHR is private
  • information in an EHR “forms the basis of decisions that have a profound impact on the welfare of the patient”
  • EHR data guide policy
  • there are information privacy laws – you need to know them in your own jurisdiction

Ethics-cloud

Image credit: Posted on Flickr by Kent State University with a Creative Commons license.
Posted in healthcare, information technology, notes, online module notes | Tagged , , , , , , , , , , , , , , | Leave a comment

Informatics, Gaming, and Simulation

Notes from module 7 of the Interprofessional Health Informatics course I’m working on (plus side reading that I did to fill in some blanks/learn more about some things mentioned in the course).

  • Gaming = “playing games developed to teach something or help solve a problem”
  • Simulation = “use of mathematical model to recruit a situation to estimate various outcomes”
  • gaming can help overcome barriers to learning such as mistrust, low literacy, social isolation, and non-traditional learning styles
  • goals of gaming:
    • increase knowledge and/or skills –> healthcare quality, health outcomes
    • increase mental, physical, emotion, and social resilience
  • goals of simulation: improving processes –> improve healthcare quality, health outcomes, at the best price
  • games start with information that is “packaged to promote learning or computed to generate knowledge” and create new data streams that can be used to improve practice, evaluate education, and enable quality and outcomes research
  • simulation research is used to support healthcare information management, decision making, education/learning
  • health games research is an emerging science
    • traditionally, nursing education was “hospitalized nursing education” – education happened in a hospital, where you learned by doing through “task-based education”
    • in the past ~20 year, nursing education has become more academic – more didactic learning (lectures, readings, seminars)
      • early in nursing school – redundant and repetitive and didactic content and then tradition exams test their mastery of the clinical content
      • then they transition to “hands on” clinical work in practicums on-site
    • but deep experiential learning experiences were lost
    • recently, there has been work to re-introduce experiential learning, e.g., through simulationSL - Play2Train
    • learning consists of:
      • context-specific (e.g., learning to do medication management)
      • socially-situated (e.g., in a hospital setting)
      • cycles of meaningful action (e.g., administering the the 5 rights of medication administration) and
      • reflection (what went well, what did not go well?) – this is where learning takes place!
    • reflective learning:
      • reflection-on-action: takes place after an action or when a person ends an action to stop and think
      • reflection in-action: services to reshape what we are doing while we are doing it; leads to “in the moment” experimentation
      • both of these are important
    • game-based teaching in simulation focuses on experiential and reflective learning
    • games allows us to experiment with action and solutions in a safe place (e.g., consequences are less than in the “real world”)
    • experiential and reflective learning seems to work well at the end of the didactic part of their curriculum (in class) and before they go into their practicum settings
    • games simulate the real world

NESIM @ Cousins Pau 1

  • to create games, you look at the real world and transition the design of the real world into a game
    • need a well-ordered problems
    • at an appropirate skill level
    • must be able to test the knowledge of the user in meaningful action
    • must encourage players to engage in reflection-in and -on-action
    • needs meaningful goals
      • clearly defined
      • motivate players to achieve success through problem solving
      • reward players after achievement of the goal
  • “possibility of spaces” – games and simulations should provide many:
    • choices
    • decisions and possibilities for action
    • strategies
    • problem solutions
  • your choices have consequences – you learn based on these
  • games need meaningful feedback and information – this is how you know what the consequences of your choices are (e.g., can be given “achievement points” for doing things “right”)
  • game development:
    • identify audience
    • define objectives
    • determine how to evaluate of students
    • determine resources (e.g., nurses to develop content, game developers who can do the tech parts)
    • develop storylines – can be very time consuming because you need to go through all the choices that the student might make and what happens from there – many, many possibilities
    • program game in a stepwise fashion
    • test the game
    • revised as needed

Computational Modeling and Simulation

  • tools used to improve processes, facility design, develop products to use in healthcare
  • methods include: statistical analysis, advanced workflow modeling, computer simulation, network analysis
  • these advanced methods can be integrated with traditional performance improvement methods, like Lean/Six Sigma
  • helps you to measure the impact of new tech, facilitate design or adoption of a best practice on workflow before having to implement it
  • improved project cycle time, because you get instant feedback from the computer scenario analysis
  • can use it for both clinical and administrative projects
  • e.g., computational modeling:
    • list all the steps, collect data (e.g., how long does it take to this step?), create a probability curve for each step, put it all together = “surrogate system”
    • take the flowchart and put it into your modeling software, then run patients through the simulation model, and collect data on what happens to those simulated patients
    • helps you identify steps that can be combined/eliminated, where are there bottlenecks, etc.
  • dynamic network analysis
    • create a matrix of every element in the network (e.g., all the people vs. all the locations) and then indicate in the cells of the matrix if information flows from that person to that location –> software takes that to create a diagram of the network
    • helps you identify nodes (e.g., clusters, bottlenecks)
    • e.g., create a current state network of all the places that the nurse needs to go to get information and then compare that to post-implementation of an electronic health record (there is advanced software and calculations that can be done.
Relationships between "top 50" UK PR twitterers

Source: Posted on Flickr by Porter Novelli Global with a Creative Commons licence.

Image Credits
Posted in healthcare, information technology, notes, online module notes | Tagged , , , , , , , , , , , , , , , , | Leave a comment

Workflow Processes

Notes from module 4 of the Interprofessional Health Informatics course I’m working on (plus side reading that I did to fill in some blanks/learn more about some things mentioned in the course). [Note: I posted this on August 5, 2015, but then it disappeared completely from my blog! Thank goodness for Google, as I was able to find a cached version so I could re-post it!]

  • it’s important to understand the flow of work of healthcare providers – and the information required to support that flow
  • “A workflow consists of an orchestrated and repeatable pattern of business activity enabled by the systematic organization of resources into processes that transform materials, provide services, or process information. It can be depicted as a sequence of operations, declared as work of a person or group, an organization of staff, or one or more simple or complex mechanisms” (Source: Wikipedia)
  • some terms in workflow:
    • actor: people or groups who do things in the workflow; each actor gets its own swim lane
    • swim lane: “a visual element used in process flow diagrams, or flowcharts, that visually distinguishes job sharing and responsibilities for sub-processes of a business process” (Source: Wikipedia); allows us to see who is doing what and how are they handing things off to others
    • terminator: indicates the beginning or end of the process (denoted by a circle)
  • when doing workflows, you want to understand:
    • what is the current process? no judgements – just map out what the process is
    • identify areas for improvement/gaps/risks
    • map out an improved process (based on the areas for improvement/gaps/risks that you identified
  • can use colour, for example, to show areas for improvement or gaps
  • to do workflows, sit down and discuss what the process is before you try to map it out
    • how does the process start and end?
    • what steps happen?
    • how does information get captured and handed off?
    • what setting does the process occur in?
    • who does what?
  • then you can map it out:
    • set up a swimlane for each actor
    • different shapes can be used for different things
      • oval or circle = start and stop of a process
      • rectangle = steps in a process
      • diamond = a decision (e.g., if answer is “yes”, follow one path; if answer is “no”, follow another path)
      • document icon = a paper document
    • arrows indicate the flow of the process from one step to the next

Here’s what a workflow diagram looks like, with vertical swimlanes

Business Workflows Diagram

Image source: Wikimedia Commons. Shared with a Creative Commons license.
Posted in healthcare, information technology, notes, online module notes | Tagged , , , , , , , , , , , , , , | Leave a comment

Informatics and Public Health

Notes from module 6 of the Interprofessional Health Informatics course I’m working on (plus side reading that I did to fill in some blanks/learn more about some things mentioned in the course). [Note: I posted this on August 5, 2015, but then it disappeared completely from my blog! Thank goodness for Google, as I was able to find a cached version so I could re-post it!]

  • Evans & Stoddart model of determinants of health:

  • Stiefel & Nolan Population Health Composite Model

  • Meaningful Use (Stage 2) standards for Public Health include the use of SNOMED CT, LOINC, and HL7
  • using EHR data for Public Health is quite different than traditional Public Health methods, such as having a national registry of reportable diseases and many other surveillance systems in CDC
  • e.g., publich health nursing information system data has been used to describe high risk population and compare health outcomes across agencies
  • mobile data is also useful in Public Health
  • big data is also useful – e.g., Google flu trends, Google dengue trends
  • a PopHR (population health record) = “a repository of statistics, measures, and indicators regarding the state of and influences on the health of a defined population, in computer-processable form, store and transmitted securely, and accessible by multiple authorized users” has been proposed
Posted in healthcare, information technology, notes, online module notes, Public Health | Tagged , , , , , , , , , , , , , , , , | Leave a comment