Clinical Informatics Outside the Walls of Healthcare Settings: Telehealth and Consumer Health Informatics

Notes from module 5 of the Interprofessional Health Informatics course I’m working on (plus side reading that I did to fill in some blanks/learn more about some things mentioned in the course). [Note: I posted this on August 5, 2015, but then it disappeared completely from my blog! Thank goodness for Google, as I was able to find a cached version so I could re-post it!]

Telehealth

  • e.g., remote patient monitoring systems – provide continuous monitoring and communicate the data from that monitoring to both the patient and their healthcare providers; this may result in better management of disease and improved health outcomes
  • medical devices are getting better due to miniaturization (making devices more convenient), communications capability (so devices can send information), the ability to converge multiple monitoring functions into a single device, and decreases in battery size.
  • wireless transmission (e.g.,. cell phones, wifi) allows devices to send information
  • once the data is sent, something needs to be done with it! We need diagnostic and analytical software to analyze the data to make it meaningful
  • one challenge is how to manage remote patient monitoring information in the context of multiple IT systems (e.g., personal health records, EHRs, data repositories)
  • telehealth is used in a number of settings
    • e.g., home health, nursing homes, ambulatory care, hospital consultations, prisons, ICU monitoring, health promotion
  • telehealth nurses can have many roles
    • e.g., nurse presenter – sets up patient to “present” to the provider on the other end of the line; nurse case manager; public health nurse, health coach; tele-ICU nursing (monitoring many ICUs)
  • telehealth can be:
    • real-time (e.g., telephone-based, web-consults; sometimes use peripheral devices)
    • store and forward (e.g., x-ray taken and send to someone)
    • combination – real-time consult using images/audio that was previously stored
  • peripheral devices – e.g., blood pressure, stethoscopes, scales, glucose monitoring, pedometers, dermascope, otoscope, EKG, portable ultrasounds, etc. – the device collects data and transmits it to someone who isn’t there
  • can be as simple as an email consult or as complex as remote monitoring of an ICU
  • all kinds of new technologies are being invented – voice prompts to remind you to take your meds, a smartbed to notify patient about to be incontinent; floor sensors for people with walking issues)
  • research shows that telehealth can increase access to health care, financial return, coordination and quality of care
  • challenges include: infrastructure, interoperability, cost, licensing/credentialing, reimbursement, and evalution

Big Data!

  • the online course linked to this resource: The Fourth Paradigm: Data-Intensive Scientific Discovery – full text available online, which I skimmed through and found some interesting stuff!
  • data-intensive science consists of:
    • capture: data can come from lots and lots of places – single laboratories, cross-laboratory studies, big international studies, individuals’ lives (think: the data from your Fitbit) [EHRs, disease repositories]
    • curation: includes “finding the right data structures of map into various stores. It includes the schema and necessary metadata for longevity and for integration across instruments, experiments, and laboratories” (p. xiii); without this, the data will only be usable by a small number of people (e.g., the lab that did the experiment) and will eventually be lost (e.g., when those people retire)
    • analysis: basically, this refers to turning the data into knowledge – e.g., analysis, modeling, predictive analytics, visualization
  • “eScience is where “IT meetings scientists”” (p. xviii)
  • science paradigms (from p. xviii) :
    • 1000 years ago: science was empirical (describing natural phenomena)
    • last few hundred years: a theoretical branch (using models, generalizations)
    • last few decades: a computational branch (simulating complex phenomena)
    • today: data exploration a.k.a., eScience (unify theory, experiment, and simulation; data captured by instruments or generalized by simulator, processed by software, stored in a computer, and analyzed)

Consumer Health Informatics

FitBit

  • Consumer health informatics (CHI) = “consumer-initiated and/or controlled information to manage one’s own health”
  • depends on literacy – but about 1/2 of Americans have difficulty processing and understanding complex text; 9/10 adults have difficulty with “every day” health information (e.g., MI vs. heart attack)
  • has many implications – e.g., do people understand how to take their medications?
    •  if people don’t have the needed information (or can’t understand it), they have trouble managing chronic diseases and aren’t engaged in decisions
    • can result things like in skipping medical tests (because they don’t understand why they are needed), poor adherence to treatment (because they don’t understand how they work – e.g., thinking that once physiotherapy appointment is over, treatment is done; didn’t understand that they need to continue to do the exercise) –> poorer outcomes –> higher costs
  • under the Affordable Care Act, health literacy = “the degree to which an individual has the capacity to obtain, communicate, process, and understand basic health information and services to make appropriate health decisions”
  • eHealth literacy = “the ability to seek, find, understand, and appraise health information from electronic sources and apply the knowledge gained to address or solving a health problem”; includes:
    • oral – speaking and hearing
    • print/visual – reading, writing, understanding visuals
    • numeracy – ability to calculate or reason with numbers
    • computer literacy – operating a computer or information device
  • “universal precautions” = “take specific actions that minimize risk for everyone when it is unclear which patients make be affected” (e.g., if you don’t know who is illiterate, you design your communications so that it will work for those with low literacy and it will work for everyone)
  • consumers are using technology to manage their health – e.g., Fitbit, blood pressure monitors, wifi scales (e.g., a congestive heart failure patient who needs to weigh themselves every day and contact healthcare provider if they gain more than 2 lbs in one day)
  • patient “portal” – allow clients to tap into their own EHR
  • consumers get health information from the web, as well as support group
Posted in healthcare, information technology, notes, online module notes | Tagged , , , , , , , , , , , , , , , | Leave a comment

Evaluation Designs When You Have Small Sample Sizes

Evaluation occurs in real-world contexts, which means that we often don’t have as much control as we do in research projects. For example, in research we may be able to randomize participants to receive an intervention or not, whereas randomization might not be possible in the real world. And even having a group that doesn’t get the intervention might not be possible 1When I say “possible” here, I mean that you might not be able to randomize due to logistical, ethical, or cultural reasons. So while it might be technically possible, you still can’t do it.. At the same time, we want our evaluations to be as rigorous as possible given our circumstances, so that we can have the best results possible. After all, if we are doing an evaluation to find out what’s working and what isn’t working well, we want the answers to those questions to be accurate so that we can make our programs as effective as possible. And if we are doing our evaluation to make a summative judgement, (such as “this program works and should be continued/rolled out to other settings” or “this program does not achieve its objectives, so needs to be fixed or stopped”), we want that answer to be correct too. Figuring out what evaluation design to use in a given situation involves determining what designs will work in our circumstances and thinking about how to maximize the validity 2Internal validity = “the extent to which a study is capable of establishing causality [and] is related to the degree it minimizes error or bias” (Fok et al, 2015). External validity = “the extent to which a research conclusion can be generalized to the population or to other settings” (Fok et al, 2015).  and power. While trying to do just that for an evaluation I’m currently planning, I came across a couple of articles that summarize some designs that can be used when we have small sample sizes and I thought it would be worth describing them here.

Randomized controlled trials (RCTs) are generally thought of as the “gold standard” for evaluating effectiveness of interventions. They have the advantages that:

  • being a prospective design where the researcher is manipulating a variable of interest, you can attribute causation to your results
  • being randomized reduces biases, such as having different characteristics of the intervention and control group resulting from allowing people to select which group them go in (or having some other reason why the members of groups are selected)
  • if they are double-blinded (i.e., neither the researcher measuring the results nor the participants know who is getting the intervention an who is in the control group), they reduce bias that could result from people expecting the intervention to work better than control

However, there are some reasons why you might not be able to use an RCT design:

  • If there are only a small number of people in the population of interest or it is extremely expensive to implement, resulting in only being able to access a small number of participants, then you will not have much statistical power to detect an effect.
  • If you have to implement the intervention to a group (instead of to individuals), and you can only have a small number of groups (since the “group” would be the “unit of analysis”), you wouldn’t have much statistical power.
  • It might not be culturally acceptable to randomize some individuals or groups to not receive a services (e.g., in some Aboriginal cultures).
  • If the community has decided they want to implement a program to everyone even though they don’t yet have evidence of efficacy.
    • It could be that the intervention has been shown to work in other places, so they have confidence that it will work in their situation, but they want to an evaluation to find out if this is true.
  • The community has already implemented the intervention and now want to evaluate if the program is achieving its intended goals.

So what do you do in these cases? Fortunately, there are some research designs that can help deal with some of these issues. The rest of this posting will discuss four of them: Dynamic Wait-Listed Design, Regression Point Displacement Design, Stepped Wedge Design, and Interrupted Time-Series Design 3I’m not going to get into the nitty gritty of statistical analysis methods for these different designs (though some of the papers that I read did discuss this). I figure once I decide on an appropriate design for my evaluation, I’ll focus on the appropriate statistical techniques for that design!.

Dynamic Wait-Listed Design (DWLD)

  • a randomized design in which:
    • participants/groups are randomized to receive an intervention right away or starting at one of a number of future time points
      • groups can be balanced into equivalent blocks and the blocks are randomized
    • the groups not yet receiving the intervention (i.e., on the “wait list”) serve as controls for those who are receiving it
    • everyone receives the intervention by the end of the study
    • outcome of interest is measured at all the time points throughout the study
  • pros:
    • increases statistical power compared to traditional wait list design (in which participants/groups randomized to either “receive intervention now” or “receive intervention later” groups; more time during which to compare the intervention to control (i.e., during traditional wait list design, once the wait list starts to receive the intervention, you no longer have anyone in the control group to compare to the intervention group).
    • Have data on almost all units from before, during initial adoption of intervention, and after adoption, so can “compare intervention impact across units and across time.” (Wyman et al, 2014)
    • increased internal validity (compared to traditional wait list design) because shorter wait time = less likely that participants will seek out another intervention
    • multiple groups make it less like that a major historical event will affect the data (compared to having only 2 groups in a traditional wait list (or even an RCT))
    • randomization  makes the design “less susceptible to readiness to participate or other biases” (Wyman et al, 2014)
    • by increasing the number of groups (compared to traditional wait list design), external vality is increased
    • reduced risk of being affected by historical events, increases internal validity
  • cons:
    • cannot double blind (as there’s no way for wait list group to not know they are ton the wait list), so does not control for placebo effect
    • those on the wait list may seek out other inventions because they know they are on the wait list.
    • can only evaluate time-limited effects
  • useful when: it has been decided that everyone will get the intervention/it is felt that it is unethical/unacceptable to leave some people/groups in a no-intervention group
  • adaptations to this method:
    • pairwise enrollment DWLD: you “start with a small number of units and “grow” a randomized trial over time by cumulating small numbers of randomized wait-listed studies”(Wyman et al, 2014)
      • select 2 units and randomize one to “invention now” and one to “wait list”
      • record outcomes of interest during the first time interval, but don’t record anything after that (i.e., when second group starts to get intervention
      • repeat with more pairs until you have sufficient statistical power to detect a difference
    • single selection DWLD:
      • select 2 units and randomize one to “invention now” (group 1) and one to “wait list” (group 2)
      • record outcomes of interest during the first time interval
      • randomly select a third group (group 3) from the wait list to serve as the next “control” group and start intervention with group 2 (the first wait listed group)
    • both pairwise and single selection DWLD do not have as much longitudinal data as DWLD (since you stop tracking data for groups getting the intervention after one time interval), they have less statistical power than DWLD

Regression Point Displacement Design (RPDD)

  • a quasi-experimental design for “evaluation of prevention programs conducted with a single intervention unit or a very small number of intervention units, when archival data for multiple units from the same population prior to and following implementation of the intervention are available” (Wyman et al, 2014)
  • a variation of the regression discontinuity design (RDD)
    • get archival data from units that haven’t received the intervention and use them to create an “expected” post-test score, which you can then compare to the actual post-test score for the unit receiving the intervention
    • the “more the selection process approximates random selection, the more valid with be the causal inference” (Wyman et al, 2014), though usually the intervention unit(s) aren’t chosen randomly (e.g., they are often chosen best on the setting with the most need or the setting that is most willing or most ready)
      • can use propensity scores to mitigate this
    • theoretically, you can use any unit of analysis, but you should choose the unit of analysis that:
      • is “sized to maximize the pretest-posttest correlation” (Wyman et al, 2014)
      • have available data for before and after the intervention is implemented
  • pros:
    • increased statistical power when you have a high correlation between pre-test and post-test scores (compared to studies that only have one or a few settings but don’t use RPDD)
  • cons: not randomized (so cannot attribute causation)
    • can use of propensity scores to mitigate
  • useful when: an implementation has already been planned or even already been implemented  and when settings are not randomly selected (e.g., due to logistics, ethics, and/or cultural norms)

Stepped Wedge Design (SWD)

  • a longitudinal design in which group receives the baseline (i.e., wait-listed control) condition and the intervention condition, with the time at which each group crosses over from baseline to intervention being randomized
  • every group eventually gets the intervention and once a group is getting the intervention, they continue to get it (i.e., it is not withdrawn)
  • the outcome of interest is measured at all time points and you compare the group(s) in the control condition to the group(s) in the intervention condition at each step of the wedge
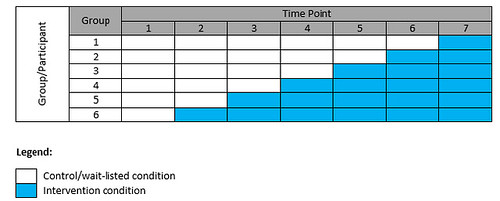
Stepped Wedge Design

  • to analyze a SWD, you use “a linear mixed-effects model that includes fixed effects for time and for intervention status at each particular time point” (Fok et al, 2015)
  • pros:
    • statistical power is:
      • related to number of time points and number of participants/groups randomized at each step
      • maximized when you randomize each group/participant to its own time step
    • reduced risk of being affected by historical events, increases internal validity
  • cons:
    • if your intervention is such that increased dosage –> strong effect, you might get a reduced ability to show an effect because those who are randomized to the later time points won’t have the intervention for very long (though you can increase the number of time points at which you measure to offset this a bit)
    • dose differs by groups, and some groups have to wait a long time
    • longer duration of the study
    • risk of contamination between those in the intervention part of the wedge and those in the control part
    • cannot blind participants to which part of the wedge they are in
  • useful when:
    • you believe the intervention will do more harm than good “rather than a prior belief of equipoise” (Brown & Lilford, 2006), so it would be unethical to withhold the intervention from the control group (as in a RCT) or to withdraw the intervention (as in a cross-over design) – e.g., when a program has been shown to be effective in another setting and you want to know if it is also effective in your setting
    • you are unable to provide the intervention to all groups at once (e.g., due to logistical, practical, or financial constraints)
    • random allocation can be seen as an ethical way to decide who gets the intervention when

Interrupted Time-Series Design (ITSD)

  • time series = multiple observations/values of a measurement are taken over a period of time
  • interrupted time-series design (ITSD) = multiple observations taken over time both before and after the intervention with the same group/participant
  • “interrupted” refers to the introduction of the intervention, thus dividing the time series into segments
  • there can be multiple groups that are getting the intervention and the time at which their baseline and intervention phases begin can be the same or differentsimplest form: A-B design (multiple observations in baseline (A), then multiple observations in intervention phase (B)).
  • reversal (or withdrawal) design: can introduce and then withdraw the intervention (A-B-A), with multiple observations in each phase; this can be extended (ABAB, ABABAB, etc.)
  • segmented regression analysis can be used to analyze ITSD
  • pros:
    • you compare the pre-post from the group to determine the intervention affect – this has the benefit of having the group/participant serve as their own control, so you don’t need to work about pre-existing differences across groups or about cross-contamination of the control group from the intervention group
    • statistical power increases with increasing number of observation
  • cons:
    • potential for seasonality effects or historical events to affect the results
    • for withdrawal design, if the effects of the intervention persist after intervention, would contaminate the subsequent “B” phases
    • requires a lot of measurements points, high cost, potential high participant burden

Some other commentary:

      • Brown et al (2009) (cited in Wyman et al, 2014) recommend calling DWLD and SWD “roll-out designs where (1) all units eventually receive the intervention, (2) the timing of units to receive the intervention is determined equitably (i.e., randomization), and (3) the design is used to evaluated effectiveness as an intervention is rolled out.”
      • those who receive intervention first may benefit from receiving it first, but those who receive it later may benefit because the intervention may be improved by feedback on the earlier implementations of the intervention being used to improve the intervention
      • another type of roll-out design: all units are wait-listed and then “at a random time they are randomly assigned to one of two alternative interventions”, which are then compared “head-to-head”
References:
Fok et al (2015). Research designs for intervention research with small samples II: Stepped Wedge and Interrupted Time-Series Designs. Prevention Science. [ePub ahead of print]
Wyman et al (2014). Designs for Testing Group-Based Interventions with Limited Numbers of Social Units: The Dynamic Wait-Listed and Regression Point Displacement Designs. Prevention Science. [ePub ahead of print]
Brown & Lilford. (2006). The stepped wedge trial design: A systematic review. BMC Medical Research Methodology.

Footnotes

Footnotes
1 When I say “possible” here, I mean that you might not be able to randomize due to logistical, ethical, or cultural reasons. So while it might be technically possible, you still can’t do it.
2 Internal validity = “the extent to which a study is capable of establishing causality [and] is related to the degree it minimizes error or bias” (Fok et al, 2015). External validity = “the extent to which a research conclusion can be generalized to the population or to other settings” (Fok et al, 2015). 
3 I’m not going to get into the nitty gritty of statistical analysis methods for these different designs (though some of the papers that I read did discuss this). I figure once I decide on an appropriate design for my evaluation, I’ll focus on the appropriate statistical techniques for that design!
Posted in evaluation, evaluation tools, methods, notes, research | Tagged , , , , , , , , , , , , , , , | Leave a comment

Electronic Health Records (EHR)

Notes from module 4 of the Interprofessional Health Informatics course I’m working on (plus side side reading that I did to fill in some blanks/learn more about some things mentioned in the course)

  • electronic health record (EHR) = “an electroic record of health-related information on an individual that conforms to nationally recognized interoperability standards and that can be created, managed, and consulted by authorized clinicians and staff across more than one healthcare organization” (US Health & Human Services)
    • interprofessional: includes clinicians and other types of staff
    • sharing of health information is a fundamental goal of the EHR
  • benefits of EHRs:
    • ready access to latest information –> allows for more coordinated, patient-centred care
    • can be life-saving (or reduce errors/give better treatment), make treatment more timely, cost-saving, better transitions, improve population
      • e.g., system tells clinician about a life-threatening allergy
      • e.g., quicker access to test results, so clinician knows what they need to know
      • e.g., information from a hospital stay can inform discharge instructions, make transition to another setting
      • e.g., with patient portals, patients can see their own data and understand how their choices affect health outcomes
  • US Institute of Medicine (2003) proposed 8 core functions of an EHR:
    1. health information and data
    2. results management
    3. order management
    4. decision support
    5. electronic communication
    6. patient support
    7. administrative processes
    8. population health reporting

Meaningful Use

  • in the US under the HITECH Act, there are financial incentives for the “Meaningful Use” of certified EHR technology to improve patient care – to get this money, hospitals/clinics/doctor’s office need to demonstrate they are “meaningfully using” their EHR by meeting certain criteria; starting in 2015, anyone who is “Medicare-eligible” will have a “payment reduction” taken off their payments if they don’t meet “Meaningful Use” benchmarks

The core objectives of Meaningful Use Stage 1 as of 2014 (Source: cms.gov):

  1. use computerized provider order entry (CPOE) for medication orders directly by any licensed healthcare provider who can enter orders into the medical record
  2. implement drug-drug and drug-allergy interaction checks
  3. maintain up-to-date problem list of current and active diagnoses
  4. maintain active medication list
  5. maintain active medication allergy list
  6. record all of the following demographic information (preferred language, gender, race, ethnicity, date of birth, and date and preliminary cause of death (in the event of death in the hospital))
  7. record and chart changes in vital signs (height, weight, blood pressure, BMI, growth  charts for children aged 0-20 years including BMI)
  8. record smoking status for patients 13+ years
  9. implement 1 clinical decision support rule related to a high priority hospital condition with the ability to track compliance with that rule.
  10. provide patients the ability to view online, download, and transmit information about a hospital admission
  11. protect EHR information created or maintained by the certified EHR technology through the implementation of appropriate technical capabilities

There is also a “menu” of other items from which you have to pick of 5 of 10 (and at least one has to be a Public Health measure):

  1. Submit electronic data to immunization registries
  2. Submit electronic data on reportable lab results to public health agencies
  3. Submit electronic syndromic surveillance data to public health agencies
  4. Implement drug formulary checks
  5. Record whether a patient 65 years old or older has an advance directive
  6. Incorporate clinical lab-test results into EHR
  7. Generate lists of patients by specific conditions to use for quality improvement, reduction of disparities, research, or outreach
  8. Use certified EHR technology to identify patient-specific education resources and provide them to patients if appropriate
  9. Perform medication reconciliation
  10. Provide summary of care record for each transition of care or referral

The core objectives of Meaningful Use Stage 2 as of 2014 (Source: cms.gov) – (note: some of these are the same as Stage 1 and some add some additional things):

  1. Use computerized provider order entry (CPOE) for medication, laboratory and radiology orders
  2. Record demographic information
  3. Record and chart changes in vital signs
  4. Record smoking status for patients 13 years old or older
  5. Use clinical decision support to improve performance on high-priority health conditions
  6. Provide patients the ability to view online, download and transmit their health information within 36 hours after discharge
  7. Protect electronic health information created or maintained by the certified EHR technology
  8. Incorporate clinical lab-test results into EHR
  9. Generate lists of patients by specific conditions to use for quality improvement, reduction of disparities, research, or outreach
  10. Use certified EHR technology to identify patient-specific education resources and provide them to patients if appropriate
  11. Perform medication reconciliation
  12. Provide summary of care record for each transition of care or referral
  13. Submit electronic data to immunization registries
  14. Submit electronic data on reportable lab results to public health agencies
  15. Submit electronic syndromic surveillance data to public health agencies
  16. Automatically track medications with an electronic medication administration record (eMAR)

There is also a “menu” of other items from which you have to pick 3 of 6:

  1. Record whether a patient 65 years old or older has an advance directive
  2. Record electronic notes in patient records
  3. Imaging results accessible through the EHR
  4. Record patient family health history
  5. Generate and transmit permissible discharge prescriptions electronically (eRx)
  6. Provide structured electronic lab results to ambulatory providers
  • in addition to the above, need to code information using ICD-9-CM or SNOMED CT (standards)
  • has “Meaningful Use” been a success? It’s too soon to know (we need more time for effects to happen and evaluation to be conducted), but there are some anecdotes that suggest there have been some successes
Posted in Uncategorized | Tagged , , , , , , , , , , , , , , , , , | Leave a comment

Indicators

Will be working on creating some indicators, so I figured it was a good time to brush up on them! Read two items – a guide and a journal article – and my notes from them are below.

The Good Indicators Guide

  • Indicators are “succinct measures that aim to describe as much about a system in as few points as possible” and “help us understand a system, compare it and improve it” (p. 5)
  • 3 key roles of measurement:
    1. “for understanding: to know how a system works and how ti might be improved (research role)
    2. for performance: monitoring if and how a system is performing to an agreed standard (performance/managerial/improvement role)
    3. for accountability: allowing us to hold ourselves up to patients, the government, and taxpayers and be openly scrutinised as individuals, teams, and organizations (accountability/democratic role)” (p. 5)
  • It’s important to reminder that indicators merely indicate – they don’t give you a definitively answer, but rather, they “suggest the next best question to ask that ultimately WILL give the answer required” (p. 5). For example, if a hospital has a high death rate, it indicates that you should look at what’s going on in that hospital. Maybe it is because things are being done poorly there, but maybe it’s because it’s a hospital where all the sickest patients are sent. Thus, it is important to understand an indicator in context. (Think  of your car’s dashboard – there’s a warning indicator light that tells you something is wrong with your car. When it flashes, you stop the car and investigate what the problem is).
  • Indicators force us to think through what it is we are trying to achieve.
  • Indicators require you to think about numbers – and it’s important to think about whether they are absolute values, ratios, etc.
  • Indicators shouldn’t be associated with “fault-finding” – they are meant to help us identify “high performers (from whom we can learn) and systems (or parts of systems that may warrant further investigation and intervention” (p. 6)
  • Measurement, on its own, won’t lead to improvement (“You can’t make pigs fatter just by measuring them!” (p. 7)). Measurement helps us understand where to look and then we need to figure out what we need to do in order to improve things.
  • The first thing you need to do is “gain clarity over what the systems is aiming to do” (p. 7). Getting everyone on the same page about what you are trying to do is a really valuable thing to do – often, there is a “lack of shared understanding” that causes “inefficiencies in a system” (p. 7)

The (Short) Anatomy of an Indicator

Example (from p. 9):

metadata metadata data
  title  definition data
infant mortality rate # of deaths of children aged < 1yr for every 1000 live births in that community in the same year 56 deaths of children aged < 1yr in a community with 4963 live births
9 deaths per 100 live births
  •  the metadata will help you decide if an indicator is:
    • “important and relevant to you
    • able to be postulated with reliable data
    • likely to have a desired effect when communicated well” (p. 10)
  • 10 keys to ask to help you create metadata for an indicator (or judge if an existing indicator’s metadata is good for your purposes) (from p. 10)
    1. what is being measured?
    2. why is it being measured?
    3. how is the indicator actually measured?
    4. who does it measure? (e.g., ages? sex/gender? everyone in a population group or some subset? if a subset, how is the subset chosen?)
    5. when does it measure? (e.g., what day/month/year? are there seasonal effects to worry about?
    6. does it measure absolute numbers or proportions? (which is most appropriate? or do you need both to get a good understanding?)
    7. where does the data actually come from?
    8. how accurate and complete will the data be?
    9. Are there any caveats/warnings/problems? (e.g., potential errors in collection, collation, and interpretation such as under sampling of certain ethnic groups, young people, homeless people, migrants, and travellers)
    10. Are particular tests needed, such as standardization, significance tests, or statistical process control to test the meaning of the data and the variation they show? (see below)
  • You want to make the most appropriate indicator that you can and populate it with the highest quality data possible. But there is a “trade-off between what is convenient (and possible) to collect, and what you ideally want”. It’s also important to remember that front-line staff are extremely busy, so you should minimize any additional data collection you ask them to do – and when you absolutely must have them collect the data, spend some time talking to them about why you are collecting the data, what you will do with it – “aim to nurture some active ownership of the data and indicators with frontline staff” (p. 11). E.g., ask staff “how the service works; what, if anything, they want to change about it; what barriers they face; what information they already collect; what they consider the fairest measure of their work process and its outcome” (p. 12)

Statistical Process Control

  • SPC involves distinguishing between:
    • common cause variation – “normal, everyday, inevitable (and usually unimportant) variation which is intrinsic and natural to any system
    • special cause variation – “which is indicative of something special happening and which calls for a fuller understanding and often action” (p. 13)
  • SPC can be used “within a single system (e.g., an institution) over time or […] to analyze variation between different institutions” (p. 14)
  • common mistake: failure to see common cause variation and special cause variation as fundamentally different, resulting in:
    • wasting resources investigating an “outlier” when that value is really within the acceptable range (i.e,. treating common cause variation as if it were special cause variation)
    • wasting resources changing a whole system that is working well overall because of an outlier that is truly an outlier (instead of focusing on that one outlier) (i.e., treating special cause variation as if it were common cause variation)
  • SPC can help you to see if you have:
    • a system where average performance is acceptable, not outlier – ideal!
    • a system where average performance is acceptable but with outliers – address the outliers (figure out what’s going on with that outlier and what to do about it)!
    • a system where average performance is not acceptable (regardless of variation) – focus on the whole system rather than individuals within the system
  • note that just because there isn’t special cause variation, it doesn’t mean the system is performing well – it could be the that whole system is underperforming. It’s important to define what an “acceptable” level of performance before you get data so you know if the performance is, in fact, acceptable. Also – think “acceptable to whom?” (e.g., if accreditation or a funding agency mandates a specific level of performance, then that would be the level of performance that’s acceptable to them)
  • Check out my previous blog postings on run charts and control charts for more info on SPC

Indicators on their own are not enough!

  • It’s important to be able to communicate to get people to change
  • 4 principles for changing the way people think:
    1. think about the audience: how can you present the information in a way that the audience (a) understands and (b) feels they can do something about it
    2. presentation matters: make it clear (use labels, text, and colour to make things readable), don’t oversimplify, but don’t let it be so complicated that you can’t read it
    3. test your approach: show the presentation to someone from your target audience to see if they understand it
    4. appeal to emotions: find the story in the data and tell the audience that story

Criteria for good indicators and good indicator sets

  • no indicator is perfect for all purposes
  • no indicator will be perfect on all of the following questions – but make sure you ask these questions, be systematic in your assessments, decide what compromises you can accept, and make explicit any compromises you are willing to make
  • first ask:
    1. Does the indicator(s) address something important?
      • indicators must:
        • measure key parts of process and/or outcome
        • related to the objectives of the system
      • if considering a set of indicators – is it a balanced set? (i.e., “all important things are covered without undue emphasis on any one area” (p. 24)
    2. Is the indicator(s) scientifically valid?
      • does the indicator measure what it is claiming to measure?
  • If you answer “no” to either of those, do not proceed with those indicators
  • If you answer “yes” to both, then ask:
    1. Is it possible to populate the indicator with meaningful data?
      • are there sufficiently reliable data available at the right time, for the right organizations with the appropriate comparators? If no, is with worth the extra effort/cost to collect the data? (If the results you get are likely to change a decision you need to make, it may be worth it. If it is just a “nice to know”, then probably not).
    2. What is the meaning? What is the indicator telling you and how much precision is there in that?
      • Once you populate the indicator with data, will you understand what it means?
      • the indicators needs to identify issues that need further investigation (but not issues that don’t need further investigation – we want signal, not noise!)
      • Will you be able to judge the acceptable limits of the value of the indicator (i.e., will you be able to tell when something is an outlier and so you need to do something about it?)
      • can you understand the indicator and what it means in terms of the reasons for the results? If you don’t understand how the indicator is constructed well enough to know what you can do with the results, it will not be useful.
    3. What are the implications (i.e., what are you going to do about the results?)
      • do you understand the system well enough to know how to act (or be willing to invest the time/resources in researching how to act) once you have results that suggest you need to do something about them?
      • is the indicator something that people are likely to “game” (i.e., you don’t want people to change superficial things in order to get the indicator results to look good- you want them to use the results to get to the root of any problems and fix the problems!)
      • does the timeframe of the data for the indicator work for your purposes? e.g., your system needs to be repsonisve enough that you’ll catch problems early, but you need to be aware that it will take time for the indicator to respond to any changes you make

Some Final Thoughts

  • “Indicators exist to prompt useful questions, not to offer certain answers. Promoting a healthy uncertainty and stimulating the right degree of unbiased, informed debate, are what indicators are all about” (p. 28)
  • “No indicator is perfect, so “the real question is: are the data good enough for the purpose in hand?” (p. 28)
  • “Indicators only indicate,; they are no more diagnostic than a screening test” (p. 29)

The (Full) Anatomy of an Indicator (from page 35-36)

Indicator name
Indicator definition  be specific (e.g., if using a proportion, specify numerator and denominator; specify units; specify timeframe)
Geography what area does the indicator data come from?
Timeliness how often is the data collected
What this indicator purports to measure
What this indicator is important (rationale)  i.e., why this topic is important
Reason to include this particular indicator  i.e., what will you do with the results (e.g., to inform program changes; to demonstrate a need for preventative actions)
Policy relevance
Interpretation: what does high/low value mean? e.g., an increased value for a diagnosis could mean there is an increasing number of people with a disorder, but it could also mean that the item is being diagnosed more now than before
Interpretation: Potential for error due to measurement method  e.g., is there potential for “gaming” the system?
Interpretation: Potential for error due to bias and confounding e.g., are some subgroups over or under represented?
Confidence intervals describes “uncertainty around a point estimate of a quantity”
Source: The Good Indicators Guide: Understanding how to use and choose indicators. National Health Service Institute for Innovation and Improvement

Making Sense of Indicators

  • indicator = “a single measure (usually expressed in quantitative terms) that captures a key dimension of health [or] various determinants of health […] or key dimensions of the health care system” (p. 24)
  • indicators can capture what is happening, but not why it is happening
  • “indicator chaos”
    • overwhelming amount of data collected
    • lack of a coordinated plan across the health system on what to collect and how to interpret/use those data
    • can lead to:
      • duplication of effort –> wasting scarce resources
      • developing programs/services that aren’t actually needed and/or useful (if data is being interpreted incorrectly and then used to inform program/service decisions) –> waste and potentially harm (if program is making things worse instead of helping)
Source: Cavanaugh, S. (2013). Making sense of indicators. Canadian Nurse. 109(1): 24-28.
Posted in evaluation, evaluation tools, knowledge translation, notes | Tagged , , , , , | Leave a comment

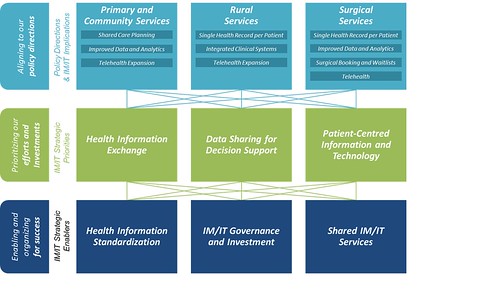
BC’s Strategy for Health Information Management & Technology

The BC government recently released a policy discussion paper on their Health Information Management and Technology (IM/IT) strategy framework.

The paper identifies a number of challenges faced at the moment:

  • lack of a common vision for IM/IT across the health sector
  • governance/leadership not aligned
  • funding sources not aligned
  • multiple existing clinical information systems that aren’t well connected to each other
  • lack of provincial clinical information standards
  • lack of comprehensive change management strategy

Here’s the framework:

BC IMIT Strategy FrameworkView the full document here: Enabling effective, quality population and patient-centred care: a provincial strategy for health information management and technology: Cross sector policy discussion paper (2015).

Posted in healthcare, information technology | Tagged , , , , , , , | Leave a comment

Data-Information-Knowledge

Notes from module 3 of the Interprofessional Health Informatics course I’m working on (plus side side reading that I did to fill in some blanks/learn more about some things mentioned in the course)

  • Data: observations (numbers, terms)
  • Information: data with meaning (answering to questions about who, what, when, where, why)
  • Knowledge: justifiable beliefs based on data and information
  • e.g., “89” and “female” are data. But what do they mean? It might signify an “89 year old woman”, but it could also be an “89 lb woman”… or even an “89 kg woman”… or “a woman with a temperature of 89°F”! We need the “data definitions” in order to make sense of these data (i.e., to turn these data into information)

Data to Wisdom Continuum

Semantic tools – used to help transform data into information and knowledge


  • The Informaticist him- or herself are also a semantic tool in that they transform data to knowledge based on their own worldview. Our cognitive function/reasoning converts data to information all the time.
  • Especially useful when:
    • semantic equivalence – more than one word or expression means the same thing (e.g., elevated blood glucose = high blood sugar; myocardial infarction = heart attack)
    • semantic gap – data may not fully represent meaning, resulting in a large gap between data and information (e.g., elevated blood glucose – what did the patient eat/drink? what meds are they on? what is their typical blood glucose level?)
  • IT professionals: manage data (using hardware, software, algorithms)
  • Informaticists: deal with information and knowledge
  • ideally, IT professionals understand the information/knowledge needs of Informaticists and Informaticists understand data – and everyone works together in an interprofessional way
Posted in healthcare, information technology, notes, online module notes, Uncategorized | Tagged , , , , , , , , , , , , , | Leave a comment

What is Health Informatics?

Notes from modules 1 and 2 of the Interprofessional Health Informatics course I’m working on (plus side side reading that I did to fill in some blanks/learn more about some things mentioned in the course)

Learning Healthcare System: “a system that learns from data collected at the point of care and applies the data to patient care improvement” 1Institute of Medicine definition, as quoted by the course instructor

Characteristics of a Continuously Learning Health Care System ((From the IOM report):

Science and informatics
  • real-time access to knowledge
  • digital capture of the care experience
Patient-Clinician Relationships
  • engaged, empowered patients
Incentives
  • incentives aligned for value
  • full transparency
Culture
  • leadership-instilled culture of learning
  • supportive system competencies

For the full table with the details, go here.

  • Note that informatics can be intricately involved in creating a “learning health care system”. Obviously, the “real-time access to knowledge” and “digital capture of the care experience” directly involve informatics, but some of the other elements could be enhanced by it as well. For example, providing patient access to their own data electronically could help engage and empower them. As well, having electronic data would allow for “full transparency”. And “supportive system competencies” include things like systems analysis and feedback loops for continuous learning and system improvement – which having electronic data/information/knowledge can greatly assist.

Health Informatics: “a multidisciplinary field that uses health information technology (HIT) to improve health care via any combination of higher quality, higher efficiency (spurring lower cost and thus greater availability), and new opportunities” (Wikipedia)

  • includes many disciplines (e.g., “information science, computer science, social science, behavioural science, management science”, etc.)
  • “deals with the resources, devices, and methods required to optimize the acquisition, storage, retrieval, and use of information in health and biomedicine”  (Wikipedia)
  • a variety of subsets, such as:

A few examples of Informatics Theories:

  • Clinical Information Systems (Blum, 1986):
    • data – individual items made available to the analyst
    • information: a set of data with some interpretation/value added
    • knowledge: a set of rules, formulae, or heuristics used to create information from data and information

Conceptual Framework for Nursing Informatics

Data to Wisdom Continuum

  • an extension of this model includes wisdom –> practice –> healthier communities

Footnotes

Footnotes
1 Institute of Medicine definition, as quoted by the course instructor
Posted in healthcare, information technology, notes, online module notes | Tagged , , , , , , , , , , , , , | Leave a comment

Interprofessional Health Informatics Course from the University of Minnesota

As I’ve mentioned previously, I’m currently working on a very large and complex health information system project. I’ve been on this project for nearly 10 months now and it has been both a fantastic learning opportunity and a chance to see my work have real and immediate effects 1A subject for a future blog posting – the process uses of evaluation! – to be sure.. One of the areas I’m learning a lot about is health information technology – and I’m about to learn a lot more. The lead for learning on the project has brought to the attention of project staff a course called “Interprofessional Healthcare Informatics” offered by the University of Minnesota through Coursera.

Coursera is “an education platform that partners with top universities and organizations worldwide, to offer courses online for anyone to take, for free.”(Source). For a fee, you can also get a certificate to verify that you passed the course, but since I already have quite a few credentials behind my name, I don’t think that it’s worth the money for me. I’m just interested in learning the content and you get all the same content in the free version.

I’ve heard good things about Coursera from friends and colleagues and, as a post-secondary instructor in both online and offline settings, I’m almost as interested in how the course is run as I am in the content.

Expect to see the notes I take during the course here – since recording notes about stuff I’m learning seems to be the primary use of this blog these days!

Wish me luck!

Footnotes

Footnotes
1 A subject for a future blog posting – the process uses of evaluation! – to be sure.
Posted in healthcare, information technology, notes, online module notes | Tagged , , , , , , , , , , , , | 9 Comments

Webinar Notes: Social Network Analysis

Webinar hosted by Canadian Foundation for Healthcare Improvement (CFHI)

    • social network analysis:
      • allows us to visualize and measure relationships in a network (e.g., how information is passed within the network)
      • can help you identify people who have connections to groups you need to work with/influence
      • can map out who is engaged in a project and who has not yet been engaged
      • can map out how information is passed through a network for your project
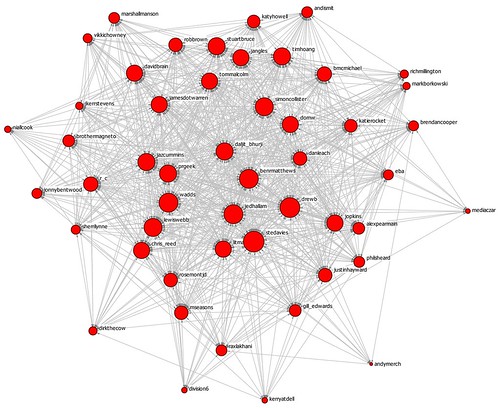
Relationships between "top 50" UK PR twitterers

Source: Posted on Flickr by Porter Novelli Global  with a Creative Commons licence.

  • definitions:
    • node: an individual in the network
    • edge: connection between two individuals
    • ego-net: the network of an individual
    • centralized: closely connected network
    • de-centralized: loosely connected network
    • nominations survey: respondents identify each other
    • roster survey: possibly nominees are identified for respondents
    • degree: # of connections between individuals
    • density: concentration of relationships
    • attributes: characteristics of an individual in the network which are of interest (e.g., location, professional role, gender, etc.)
  • theory behind SNA
    • relationships are important (vs. just individual’s attributes)
    • networks are powerful influences on behaviour (e.g., a teen who is in a network with smokers is more likely to become a smoker)
  • you do a nominations survey (you give a roster of all the people in the organization to respondents and have them list, e.g., “who do you go to for advice” or “who do you collaborate with”)and then can make a matrix showing who is connected to whom
  • note that one person might name someone but that person might not name the first person
  • can take the matrix and turn it into a graph of the network
  • can calculate measures (e.g., outdegree: how many times a person is named by others, indoor: how many times a person was named by other people)
    • individual  measures- centrality: (degree, closeness, betweenness, eigenvector), persona network destiny, constraint, homophily (on any characteristics) – how similar are your friends on a given characteristic (e.g., girls friends with girls, boys friends with boys), structural equivalence, group membership, clique membership
    • network measures : size, density, transitivity, clustering, average path length
  • he uses UCINet (software program – can get 3 month free trial online), but there are many others
  • in the graph, can identify highly connected people and recruit them as change agents for your project; can identify tight groups (e.g., if they are resisters, they will likely influence each other as a group)
  • can also map out team structure – e.g., is your team tightly knit? are all team members equally connected to each other or are some isolated? how well is your team reaching out to others in the organization (e.g., will help you diffuse your idea out to the rest of the org)
Posted in evaluation tools, methods, notes, webinar notes | Tagged , , , , , , | Leave a comment

KT Canada Conference – Day 2


Day 2 of the two-day conference. More notes from the sessions!


Plenary: Andreas Laupacis “Patient engagement in research and health care: its values, science, politics, and art”

  • used the James Lind Alliance process for coming up with their top 10 research priorities for dialysis
    • brings together patients, their caregivers, and clinicians (always as many patients/carers as clinicians)
  • Healthy Debate – adding a section “Faces of Healthcare”, inspired by “Humans of New York
  • MASS LBP – does public consultations
  • he feels even if there isn’t an impact on the final result (e.g., even if the decision isn’t different than it would have been without them there), we should have patients involved in developing health systems & policies, as they are the ones taking the risks of a given treatment, and they are the ones funding the system as taxpayers; however, often the decisions are affected by the patients’ input
  • when you compare the top 10 research priorities on dialysis coming from the JLA process to what’s been published/clinical trials currently going on, and only 18% of the research being done addresses those priorities (though they can’t get anyone to publish this finding – been rejected by 8 journals so far. Publication bias?)
  • some are afraid to engage the public, as it takes control away
  • need to engage a broader array of patients/public – need to make a concerted effort to engaged marginalized/vulnerable populations [bodes well for our presentation later this afternoon on a model for engaging marginalized populations]
  • people often worry about whether we’ll get good enough “representation” of patients – won’t the people engaged be just serving their own interests/agenda… but we don’t seem to worry about that when we engage clinicians/researchers – won’t they too be only able to “represent” their own interests? So while we do want to get more diversity in patients, we ask people to bring their perspective and to listen to others as well
  • Minister of Health in Ontario’s top 3 priorities: equity, transparency, and patient involvement

Workshop: François-Pierre Gauvin, “Engaging with and learning from the public: the McMaster Health Forum’s public-engagement platform to support evidence-informed policymaking”

  • values and experiential knowledge of the public is increasingly being recognized as legitimate evidence to help inform policy
  • evidence-informed policy making = using best available data and research evidence – systematically and transparently – in the time available to influence policy
  • EIPM – challenging because
    • facing complex health challenges (e.g., bringing technical, political, ethical, etc. issues)
    • facing uncertainties about most effective policy options to address the problems and the implementation of the options (e.g., equity, costs, unintended effects, fesability) – research evidence may be difficult to interpret, unavailable
    • often no agreement about how to move forward
  • the public:
    • can help us develop a shared understanding of the problem
    • has experiential knowledge  to help us find innovation and local solutions to complex problems
    • can facilitate or trigger action
  • public engagement = a range of efforts used to involve the public (citizens, patients, service users, family caregivers, etc.) in various stages of policymaking
  • there has been a deliberative turn in public engagement – people coming together, talking & listening to each other , come to more reasoned, informed and public spirited judgements (Abelson, 2010)
  • Health Canada proposed a continuum of levels of engagement

(Source: Health Canada)

  • Abelson, 2010 – we don’t know enough to draw conclusions about comparative effectiveness of different types of public engagement mechanisms (studies on this are diverse and of mixed quality)
  • McMaster Health Forum
    • do a lot of “communications”, but also some “consulting” level
    • their Twitter account
  • small group activity: discuss how we can improve the reach and usefulness of public talks (target audience: 60+)
    • e.g. in New Brunswick, politician who came to discuss government policies re: admissions to nursing homes (e.g., increase cost of nursing homes based on ability to pay) – started session with an advocate for seniors re: nursing homes
      • at the Legion – accessible, good parking, safe, non-political environment
      • Friday afternoon 1-4 pm
      • huge turnout
      • politician listened to the stories – told the audience “I am listening. I will take that back” – politician had to leave, but CARP (organizer of the meeting) left the microphone open and recorded it for the government. Politician did not provide any information about what was actually going to be in the legislation and minimized the input of the audience (e.g., seniors suggested road tolls for revenue, politician dismissed the idea)
      • headlines in the newspaper slamming the politicians
      • no follow up afterwards
  • McMaster Optimal Aging Portal
    • in 2009, 75% of Canadians 65+ use the Internet 1+ days per day
    • 70% of them use the Internet to find medical information
    • created the  Optimal Aging Portal
    • tweet about evidence syntheses related to what’s in the news from @Mac_AgingNews
  • http://evidencenetwork.ca/
  • citizen panels – a forum to get voice of citizens/patients/service users
    • one-day, off the record dialogue
    • bring their views and experiences, read “citizen brief” of the latest evidence, share their new ideas after going through the dialogue
    • people will not participate in this unless they believe that the findings of the citizen panel will actually make a difference – so they set up a relationship with someone who can actual act on the findings
    • Chatham House Rule: “anyone who comes to the meeting is free to use information from the discussion, but is not allowed to reveal who made any comment. It is designed to increase openness of discussion. (Source.)

Oral Presentations:

  • Shannon Scott – systematic review of the use of process evaluations in KT research – a project currently underway
    • process evaluations – study running parallel to or following a trial, trying to understand how the intervention worked and what factors may have shaped outcomes
    • process evaluations explore causal mechanisms in KT intervention studies – but no methodological standards to guide their design
    • Lewin et al, 2009 – BMJ: 339:b-3496  and Grant et al, 2013, Trials: 14:15 (offer some targeted recommendations for cluster RCTs, not a systematic review of the literature)
    • this study wants to explore the state-of-the-science and to look at effectiveness of different process evaluation methods
    • using Mixed Methods Appraisal Tool (MMAT) to assess methodological quality
    • most of the studies collected data *after* the intervention was implemented (surprising, since this is process evaluation); 25% used a theory
    • current doing more analysis – want to ultimately be able to make recommendations for people doing process evaluations along side intervention studies
  • Jennifer Tomasone “In search of “key ingredients”: a multi-level approach to the implementation-effectiveness relationship of an educational intervention for healthcare professional trainees”
    • only 3% of people with physical disabilities are physically active
    • idea was to get healthcare professionals to talk with their patients about being physically active
    • standard curriulum + local adaptations
    • wanted to identify what are the “key ingredients” from this program (since they aren’t all implementing it the same way)
    • used multi-level modelling
    • had presenters fill out form re: their own demographics and what they did during the presentation – originally meant to measure fidelity, but ended up being really useful implementation data for their modelling
  • Holly Witteman – “User-centredness of development processes for patient decision aids and other patient-oriented tools: a measure derived from a systematic review”
    • aids to help patients make a decision (not just to give patients information)
    • preliminary results from their study on describing current practices in engaging users (project has other aspects they haven’t yet done)
    • develop a prototype –> observe them using the prototype (it’s different than asking people what they thought)
    • “If I had asked people what they wanted, they would have said faster horses” – Henry Ford

My colleague, Katie Tweedie, and I gave a presentation on “Including Marginalized Patients in Health Care Services Planning.” I had assumed our presentation would be in a breakout room, but it turned out that all of the sessions were held in the big conference room, so the whole conference was at our session! Throughout yesterday and today, several people were mentioning that we need more diversity in the patients we engage and that we need to talk about power inequities, so I was happy that we were scheduled to present on the tool we created to help people engage patients whose voices traditionally have not been heard in healthcare planning, a model which includes explicit discussions about power. We got some great feedback after the session and I gave out all the copies of the books that I’d brought (since I thought we’d be in a breakout room, I only brought a dozen copies), then gave out a bunch of business cards so people could email me and I can send them the link to download the books. Speaking of which, here’s a link to our handbook & workbook.

To Do:

Posted in event notes, healthcare, knowledge translation, notes | Tagged , , , | Leave a comment